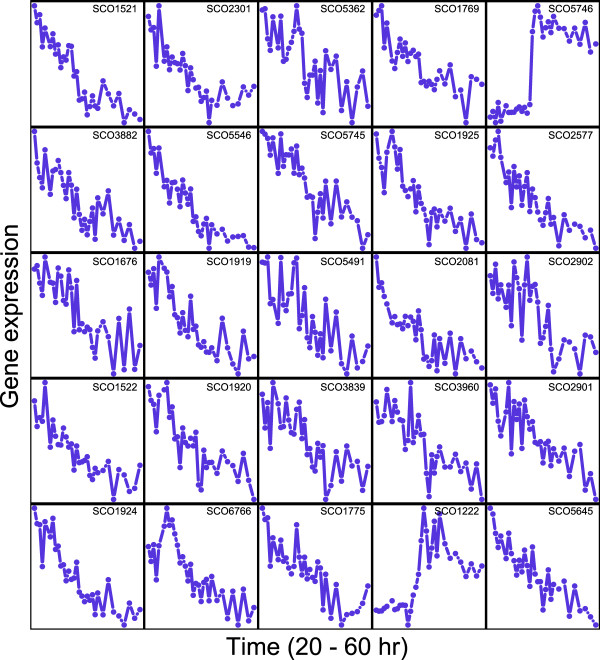
Figure 1.
Average expression profile of the top 25 candidate orphan genes. This figure shows the expression profiles of the candidate genes during the phosphate-starvation experiment described in the text. Phosphate depletion occurs between time point 15 and 16 (i.e., between 35 and 36 hours after the start of the culture).

