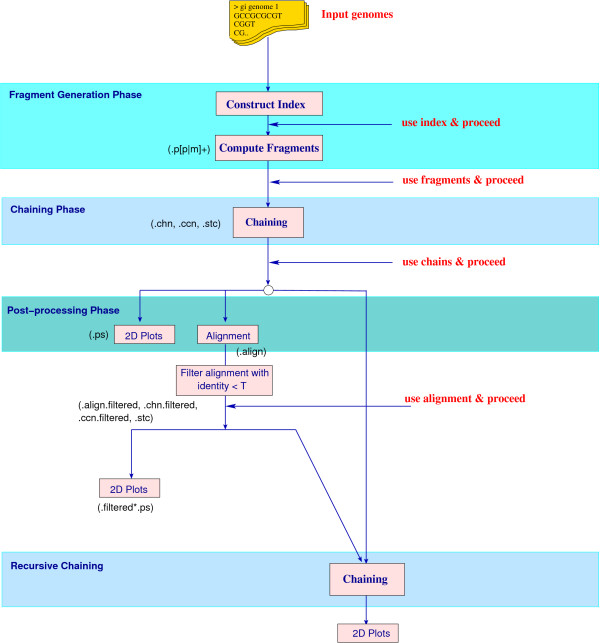
Figure 3.
CoCoNUT block diagram. The data-flow in CoCoNUT for the task of comparing multiple genomes. The user can repeat the comparison starting in any of the four phases (marked as use index, use fragments, use chains, and use alignment) and proceed further in the comparison. The extensions of the files produced in each step are shown in brackets; see also Table 1.

