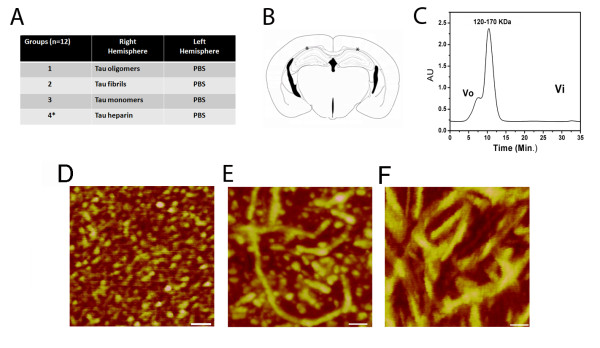
Figure 1.
Experimental design and characterization of tau samples. (A) Mice were divided into four groups, one injected with tau oligomers and PBS, a second group injected with tau fibrils and PBS a third group injected with tau monomers and PBS, and a fourth group injected with tau heparin fibrils and PBS used as a control (*). (B) Schematic representation of a coronal section of a mouse brain with * indicating the injection sites of the tau preparations in PBS. (C) FPLC profile of tau oligomers injected into mice brains. (D) AFM image showing homogeneous population of tau oligomers (scale bar = 140 nm). (E) AFM image of tau fibrils (scale bar = 70 nm). (F) AFM images of tau fibrils prepared with heparin (scale bar = 50 nm).

