Figure 6.
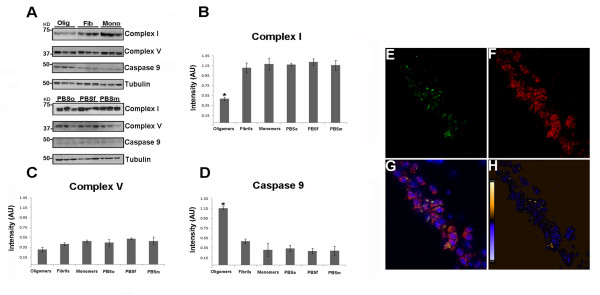
Tau oligomers induce mitochondrial alterations. (A) Representative western blot of mouse brain homogenate. The levels of complex I, complex V, and caspase-9 were measured by band quantification and normalized with the levels of tubulin. Abbreviations are as in Fig. 4. (B) Complex I levels were significantly lower in the hemisphere injected with tau oligomers in comparison with the ones injected with fibrils or monomers. (C) No differences in the levels of complex V were observed in any of the groups. (D) Caspase-9 activation was significantly higher in tau oligomer groups over both tau fibril- and monomer-injected groups. (E-G) Double staining between human tau-specific antibody HT7 (green fluorescence) and mitochondrial porin antibody (red fluorescence) demonstrates the internalization of tau oligomers in CA1 cells and their interaction with the mitochondria. (H) The co-localization of tau oligomers with mitochondria was confirmed by ICA of the signal. Data are represented as mean ± SE. *p < 0.01, n = 6.

