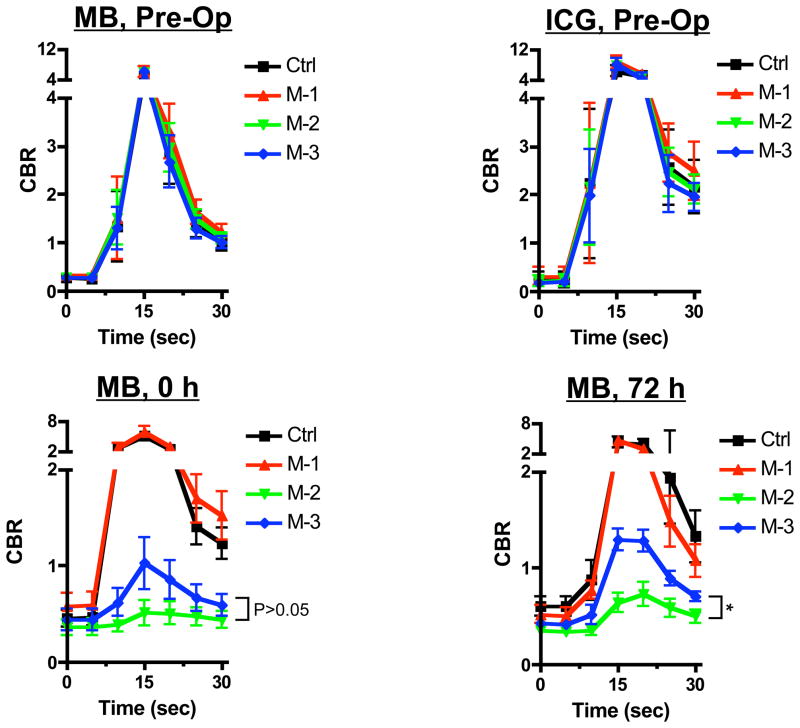
Figure 3. Quantitative assessment of nipple imaging using NIR fluorescence.
Direct comparison of CBR (mean ± SEM) between different fluorophores (MB and ICG) or all models (black line, control; red line, model 1; green line, model 2; and blue line, model 3) using MB (upper left, preoperative; lower left, 0 h; and lower right, 72 h) and ICG (upper right, preoperative). The statistical assessment was from linear mixed effects models with variance-covariance structure of compound symmetry. P values for the indicated statistical comparisons are as follows: * = P < 0.05.

