Figure 2.
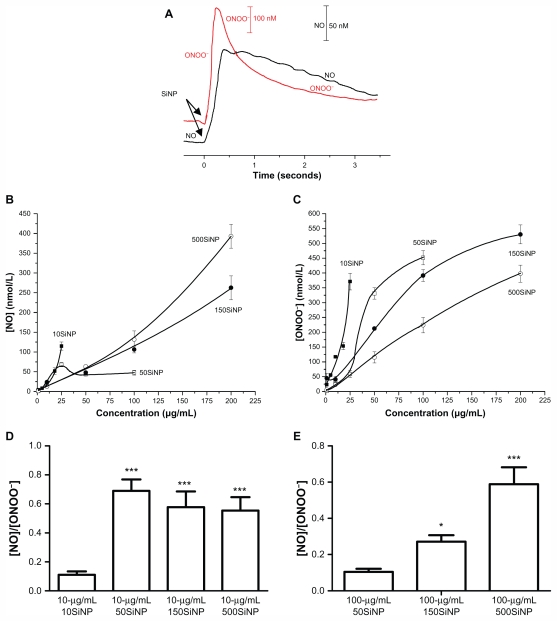
Amorphous SiNP induce NO and ONOO− production and unfavorably shift the [NO]/[ONOO−] balance in primary human umbilical vein endothelial cells. (A) Representative recordings of NO and ONOO− concentrations measured in situ by specific nanosensors placed 5 ± 2 μm for the surface of a single cell after addition of 25 μg/mL 10SiNP (arrows) to the cell culture media. Maximal concentration of NO (B) and ONOO− (C) released from cells following stimulation by 10SiNP (■), 50SiNP (□), 150SiNP (●), and 500SiNP (°). All values are presented as the mean ± standard error of the mean of n = 4. One-way analysis of variance and Tukey–Kramer multiple comparison tests were used to analyze all sets of data. [NO]/[ONOO−] ratio of the maximal NO and ONOO− concentrations measured upon stimulation of cells by SiNP at 10 μg/mL (D) and at 100 μg/mL (E).
Notes: All values are presented as the mean ± standard error of the mean of n = 4. One-way analysis of variance, Tukey–Kramer multiple comparison test: *P < 0.05, ***P < 0.001 compared with 10 μg/mL 10SiNP (D) and compared with 100 μg/mL 50SiNP (E).
Abbreviation: SiNP, silica nanoparticles.

