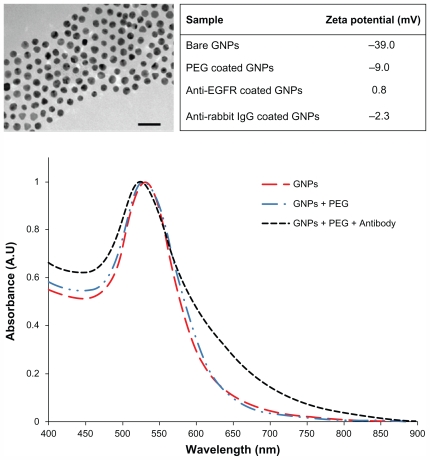
Figure 1.
Characterization of gold nanoparticles (GNPs). Upper left: transmission electron microscopy image of 30 nm GNPs (scale bar 100 nm). Upper right: zeta potential measurements at the various stages of GNP coatings. Bottom: ultraviolet-visible spectroscopy of the bare GNPs, polyethylene glycol (PEG)ylated GNPs, and anti-epidermal growth factor receptor (EGFR)-coated GNPs.
Abbreviations: A.U, abitrary unit; IgG, immunoglobulin G.

