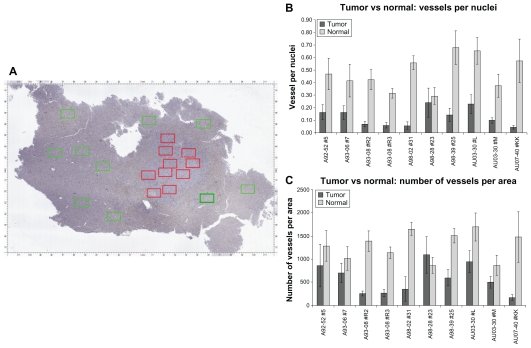
Figure 6.
Quantitative measurement of vessels in normal liver and adjacent metastatic breast cancer in ten cases. Panel A: representative whole slide image of a histological liver section containing both normal tissue and tumor. Each rectangle represents a randomly chosen region (green = normal, red = tumor; dimensions = 1.2 × 0.75 mm; 100× magnification). Panel B: the vessels-to-nuclei ratio in tumor regions is lower and more variable than in normal areas. Panel C: tumor regions have a lower number of blood vessels per area than in normal tissue.

