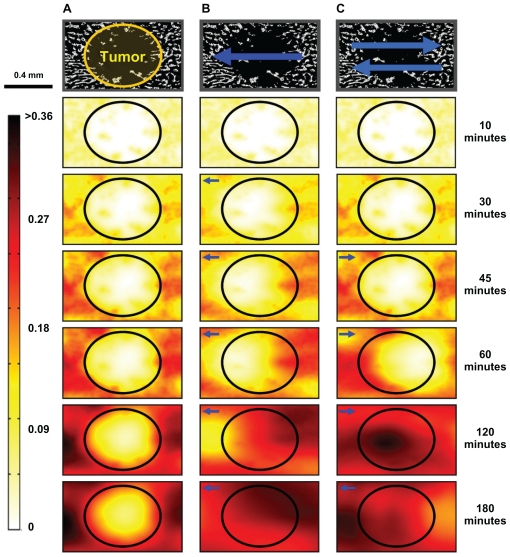
Figure 8.
Time progression of nanoparticle concentration for the three treatments. The panels across the top were from a histological image of normal liver containing a small metastasis (marked by the circle). (A) Nanoparticle concentration with no magnetic forces and only diffusive effects. The tumor region had a low nanoparticle concentration even after 180 minutes. (B) Nanoparticle concentration with a constantly applied magnetic force to the left (west). The nanoparticles were displaced to the left, increasing the particle concentration in the tumor. (C) Nanoparticle concentration with an alternating magnetic force first to the right (east) and then to the left (west). Nanoparticles from surrounding normal tissue were effectively brought into the tumor region by dynamic magnetic shift.

