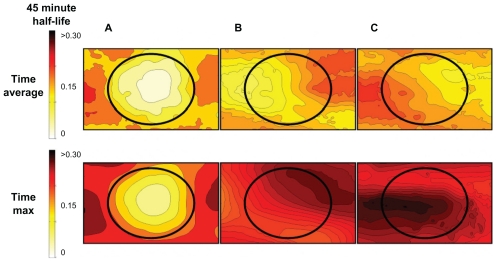
Figure 9.
Visualization of the time-averaged (for slower-acting therapies) and time-maximum (for fast-acting therapies) concentration of therapy in normal and tumor tissue for the three cases from Figure 8. The top shows the time-averaged nanoparticle concentrations achieved across the tissue section over the 3-hour treatment window using: (A) diffusion only, (B) a left magnetic pull only, and (C) a two-directional magnetic pull. The tumor in the center of the image receives both significantly higher average and time-maximal nanoparticle levels when dynamic magnetic shift is applied.

