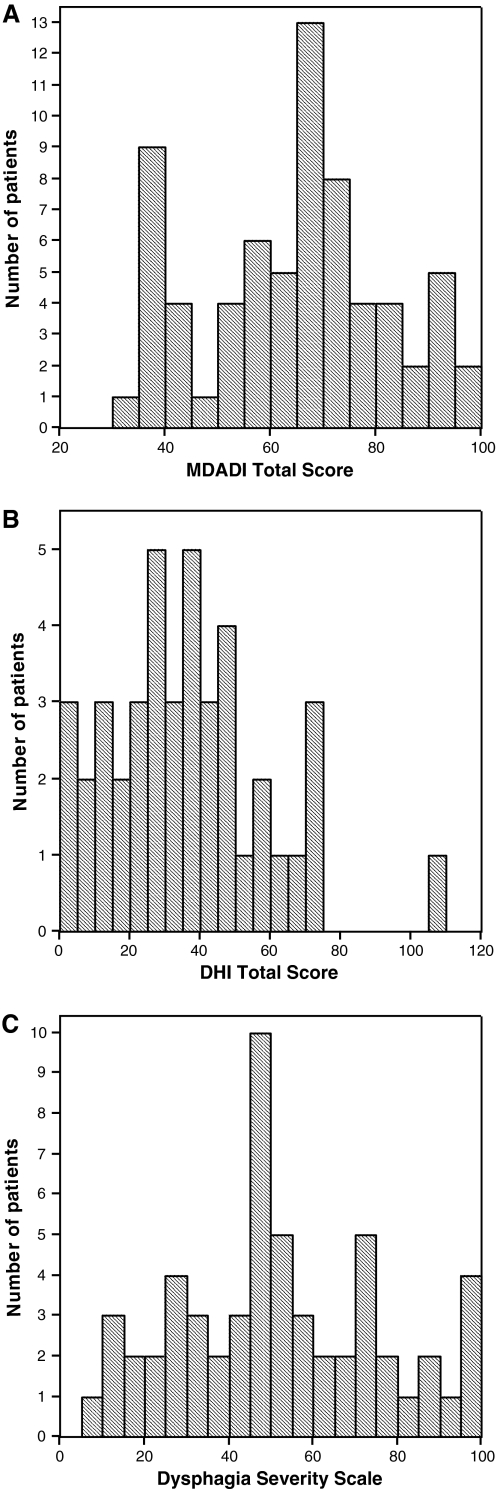
Fig. 1.
a Data distribution on the MDADI. The number of patients is displayed as a function of the Total Score on the MDADI. The area under the curve equals the total number of patients. b Data distribution on the DHI. The number of patients is displayed as a function of the Total Score on the DHI. The area under the curve equals the total number of patients. c Data distribution on the Dysphagia Severity Scale. The number of patients is displayed as a function of the score on the Dysphagia Severity Scale. The area under the curve equals the total number of patients

