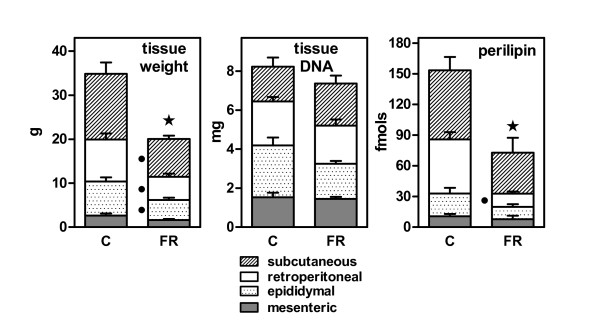
Figure 1.
Effect of 10 days of 40% food restriction on WAT site weight, DNA content, and the expression of perilipin gene. The data correspond to the mean ± sem of six different animals. Gene expression data are presented as fmols of the corresponding mRNAs in the whole WAT site. C = controls fed ad libitum; FR = food restricted. Statistical significance of the differences between data groups. A star indicates an overall (i.e. combined WAT sites) significant (P < 0.05) difference between FR and C. A black dot indicates a significant difference in mass/gene expression for a given WAT site between FR and C.

