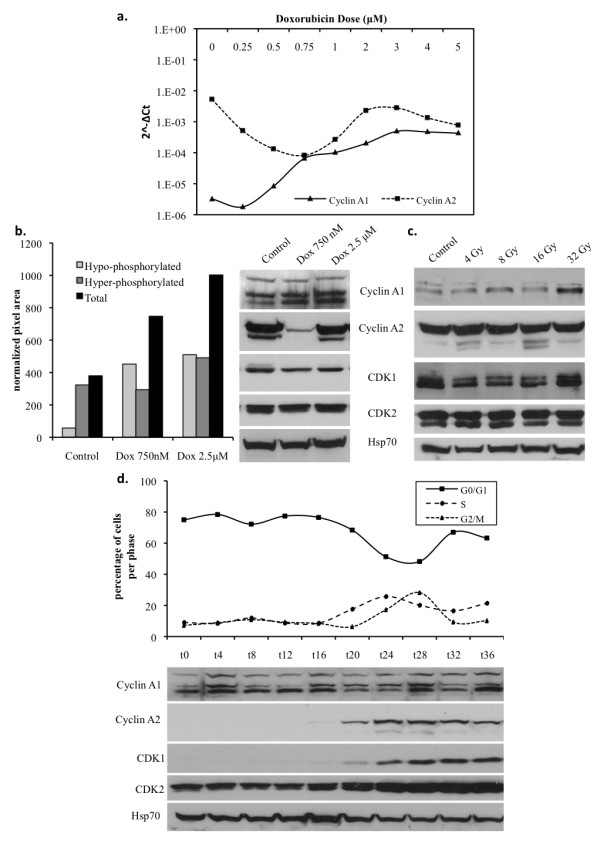
Figure 1.

DNA DSBs induce an upregulation of cyclin A1 but not cyclin A2 in A549 cells in a cell cycle-independent manner A) Relative expression levels respect to GAPDH (2^-ΔCt) of cyclin A1 (CCNA1) vs. cyclin A2 (CCNA2) mRNA after 24 hours of treatment with increasing doses of Doxorubicin (250 nM to 5 μM). B) Western blot analysis of cyclin A1, cyclin A2, CDK1 and CDK2 expression levels with Hsp70 as a loading control after 24 hours of treatment with Doxorubicin (Dox 750 nM and 2.5 μM). Quantification of cyclin A1 expression levels as normalized pixel area respect to Hsp70. C)Western blot analysis of protein expression 1 hour after administration of increasing doses of γ-irradiation (4 Gy to 32 Gy). D) Flow cytometry cell cycle analysis with corresponding western blot showing cyclin A1, cyclin A2, CDK1 and CDK2 expression levels over the course of the synchronous cell cycle induced by serum starvation.
