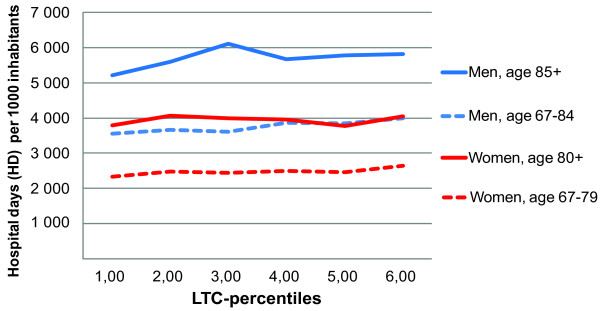
Figure 3.
Fully adjusted modela: Association between long-term care (LTC) rates and hospital day rates. By age and sex. Norwegian population. National average across years 2002-2006. 1st percentile group represents the 17% lowest percentage in each 5-year age group. aAdjusted for age, mortality, travel time to hospital, education, and composite variable of "municipality population size" and "hospital status", with municipality as random factor.

