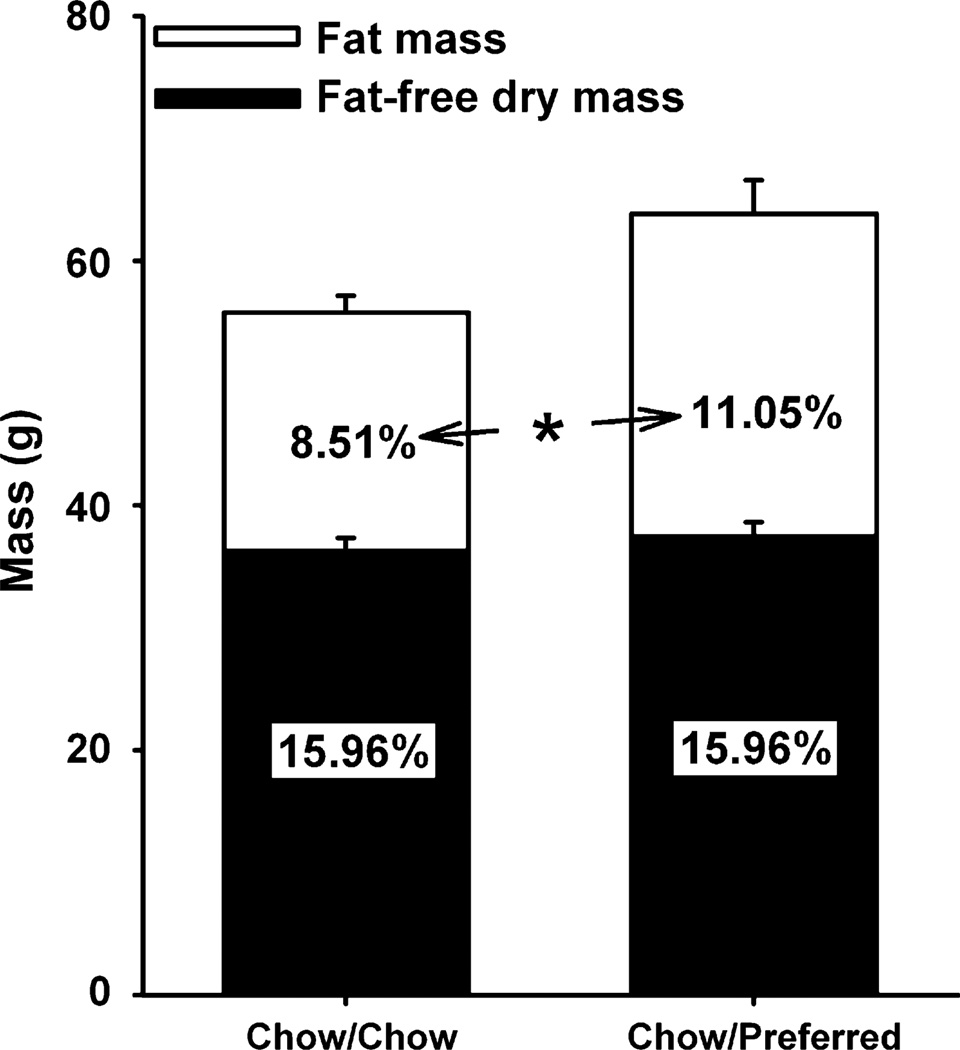
Figure 7.
Long-term effects of diet schedule on body composition. Panel shows (M ± S.E.M.) fat mass and fat-free dry mass of a random subset of female Wistar rats from Experiment 1 (n = 15). On Day 92, rats were fed chow diet only for 10 consecutive days to control for acute diet effects. On Day 102, overnight fasted rats were decapitated 2–5 h into the dark cycle. Stacked bars represent absolute weights, and inset numerals indicate percent of total carcass mass. *Both absolute and relative fat mass of Chow/Preferred rats differ from Chow/Chow rats, p < 0.05.

