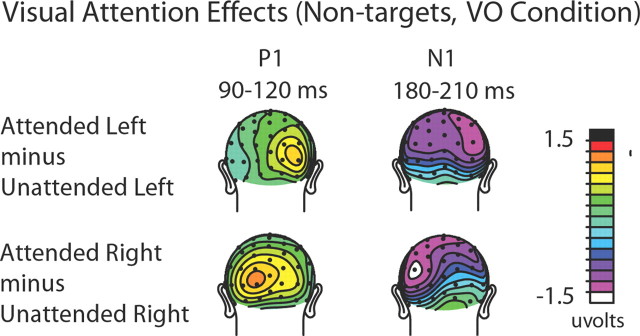
Figure 3.
Visual attention ERP effects from the visual-only (VO) condition. Topographic distributions of the attention effects (attended minus unattended) for the P1 (90–120 ms) and N1 (180–210 ms) sensory components are shown separately for left-visual-field stimuli (top) and right-visual-field stimuli (bottom). As can be seen from the distributions, when the visual stimuli on the left were attended, they elicited right-sided (i.e., contralateral) P1 and N1 attention effects over occipital cortex. When the visual stimuli in the right visual field were attended, the P1 and N1 attention effects were correspondingly observed over the left visual cortex.

