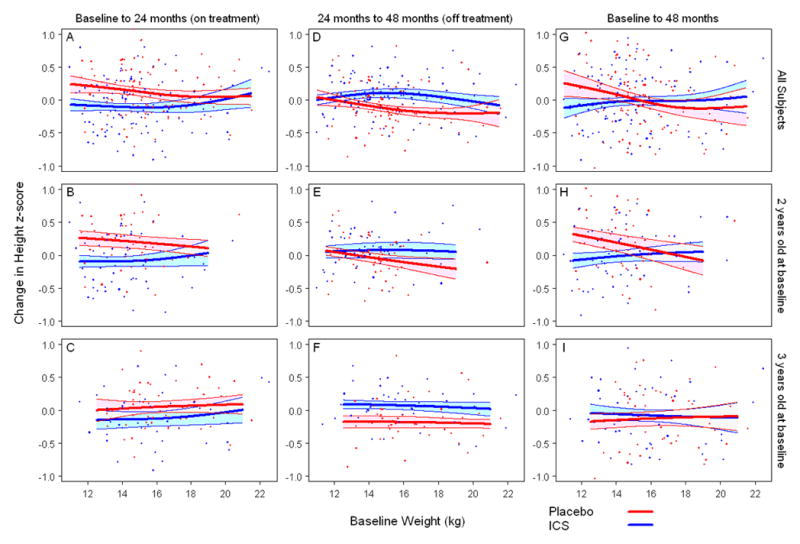
Figure 2.

Scattergrams of growth from baseline (z-score) during treatment versus enrollment weight by treatment group. Top panels: overall cohort, middle panels: subjects 2 years old at enrollment, bottom panels: subjects 3 years old at enrollment. Children at particular risk for less linear growth during treatment were those that had an enrollment weight of <17 kg versus those that had a lesser exposure compared to their respective placebo counterparts (Panel A). This was more pronounced in the children who were two years of age at enrollment (Panel B). After the ICS treatment ended, these younger children of lesser weight (relative to the cohort) did not demonstrate the same catch-up in linear growth demonstrated by the younger, heavier children (Panel E) or older children of any weight (Panel F). Two years after treatment discontinuation, less linear growth was observed in only the younger children of lesser weight (Panel H). Solid lines (blue:ICS, red:Placebo) represent fitted values from non-parametric smoothing spline with 95% confidence bands (24). All data values were used for model fitting, but estimated regression lines are truncated to avoid extrapolation beyond the main part of the data.
