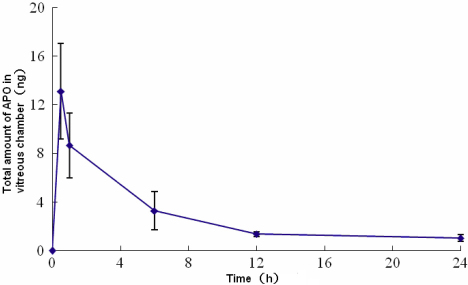
Figure 2.
Time course of changes in total amount of APO in the vitreous chamber after subconjunctival injection of APO. The amount of APO in the vitreous chamber peaked 0.5 h or less after injection and decreased rapidly, reaching a plateau at 12 h and maintaining plateau levels at 24 h. The data at each time point was from cross-section measurements.

