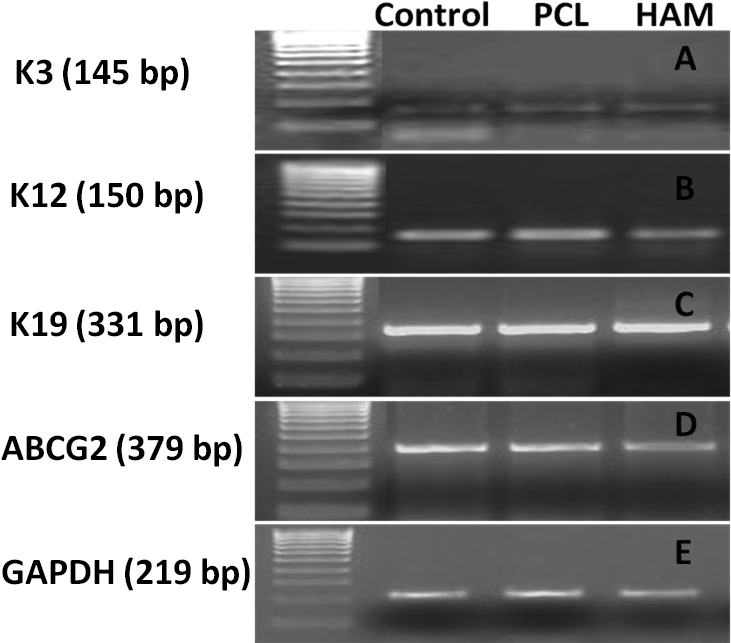
Figure 11.

RT PCR analysis of LECs expanded over PCL nanofibers, HAM and control surface (coverslip): Differentiation markers (A) K3 (145 bp), (B) K12 (150 bp) and stem cell–associated (C) K19 (331 bp), (D) ABCG2 (379 bp), (E) GAPDH (219 bp) used as an internal control.
