FIG. 1.
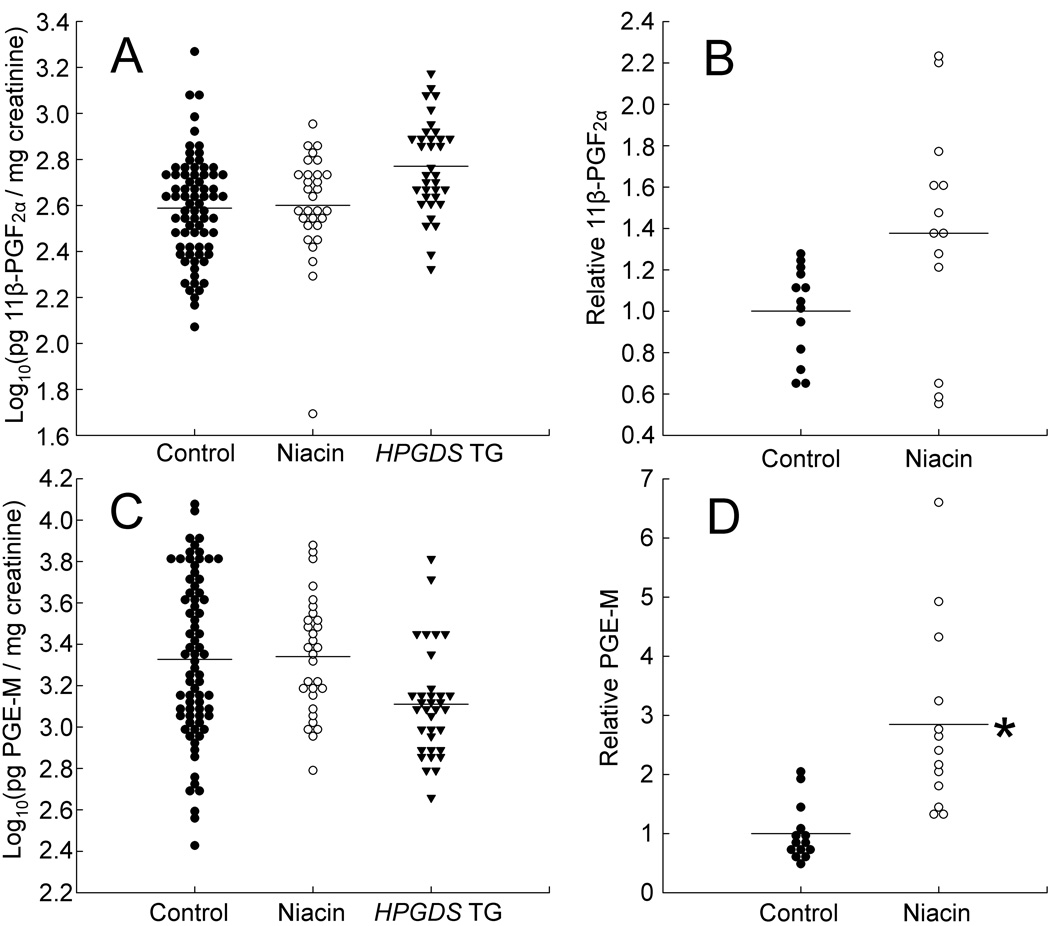
Urinary excretion of 11β-PGF2α (a major PGD2 metabolite) and PGE-M (the major PGE2 metabolite). Numbers of urine specimens, numbers of mice, and results are summarized in Table 1. A: Urinary 11β-PGF2α in relation to 1% niacin and HPGDS transgenes. 11β-PGF2α levels (in pg per mg of creatinine) were transformed to logarithms (base 10). Estimated mean levels were 403, 385 (P = 0.94), and 633 (P = 0.19), for controls, mice on 1% niacin, and HPGDS transgenic mice, respectively. The graph includes data on mixed background mice (C57BL/6 × FVB/N) as well as C57BL/6 mice, but no ApcMin/+ mice. B: Relative urinary 11β-PGF2α excretion levels in 4 mice that alternated between the control diet and the 1% niacin diet. For each of these 4 mice, urine prostaglandins were measured on the control diet and on the 1% niacin diet. All prostaglandin levels for each mouse were divided by the mean value of the control measurements for that mouse. Data for all 4 mice were then pooled and analyzed. The mean increase in 11β-PGF2α excretion on the 1% niacin diet was 1.34-fold (P = 0.07). Numbers of urine specimens and of mice are shown in Table 1. C: Urinary PGE-M in relation to 1% niacin and HPGDS transgenes. PGE-M levels (in pg per mg of creatinine) were transformed to logarithms (base 10). Estimated mean levels were 1,995, 2,196 (P = 0.92), and 1,622 (P = 0.72), for controls, mice on 1% niacin, and HPGDS transgenic mice, respectively. The mice were the same as used for panel A, except there were a few missing data, due to inadequate amounts of urine for a few of the mice. D: Relative urinary PGE-M excretion levels in 4 mice that alternated between the control diet and the 1% niacin diet. Data were collected and analyzed as for panel B. The mean increase in PGE-M excretion on the 1% niacin diet was 2.85-fold (P = 0.02).

