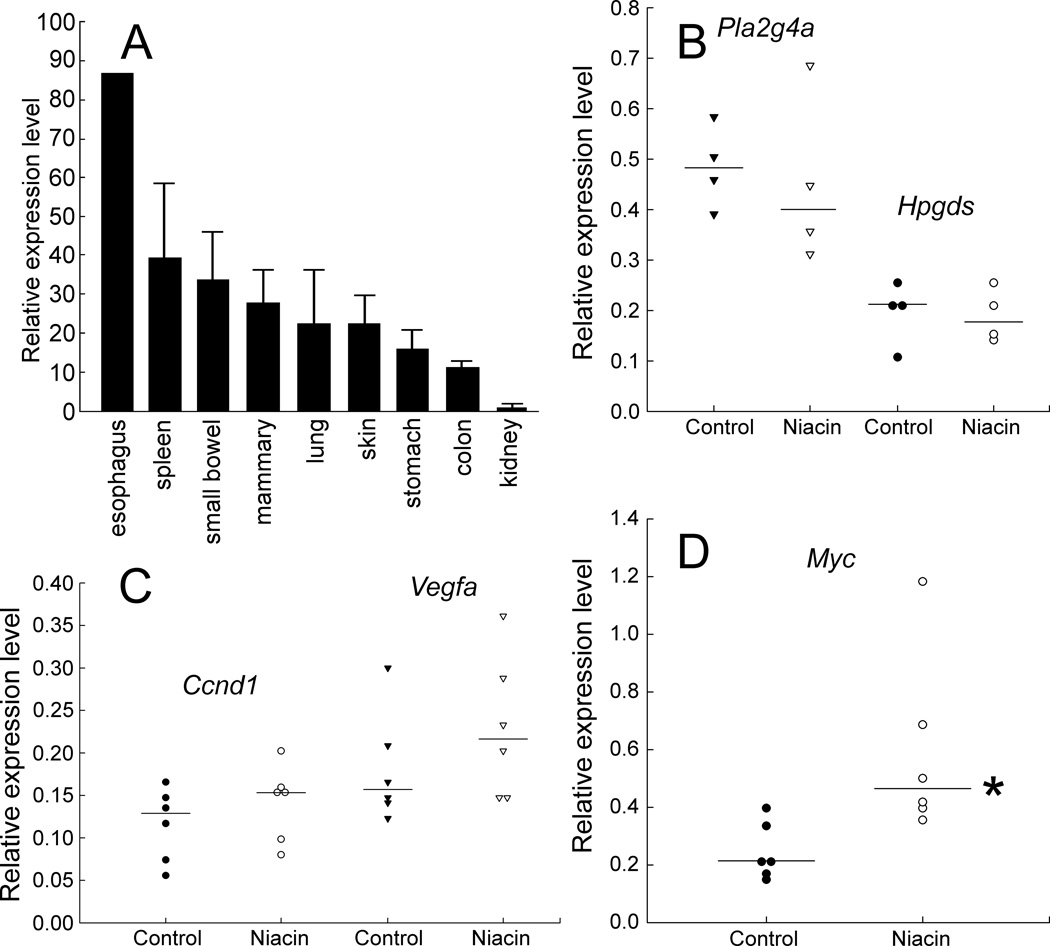
FIG. 2.
Expression of Gpr109a, selected prostaglandin biosynthetic enzymes, and growth factors in the experiment. A: Gpr109a mRNA in 9 tissues in wild-type, mixed background mice (C57BL/6 × FVB/N). All mice were on a diet with no supplemental niacin. Levels were expressed relative to mRNA levels for endogenous mouse glyceraldehyde-3-phosphate dehydrogenase (Gapdh). The Gpr109a level in the kidney was set to 1.0 (lowest value). Thick bars represent the average expression among 3 mice. Lines indicate standard deviations. mRNA levels for all tissues were measured in triplicate for each mouse. No standard deviation is shown for the esophagus, because tissue specimens from the 3 mice were combined (specimens were too small to assay individually). The esophagus had the highest Gpr109a expression among the tissues tested, followed by the spleen. Gpr109a expression levels were fairly comparable among the small intestine, mammary gland, lung, and skin. B: Cytosolic phospholipase A2 (Pla2g4a) and hematopoietic prostaglandin D synthase (Hpgds) expression in the colon. mRNA was measured in colon tissue of ApcMin/+ mice on a control diet or daily 1% niacin. Levels were expressed relative to mRNA levels for endogenous mouse Gapdh. The plotted points represent triplicate measurements in different mice. Horizontal bars indicate medians. Median values for control and niacin-fed mice (respectively) were: for Pla2g4a, 0.48 and 0.40 (P = 0.71); for Hpgds, 0.21 and 0.18 (P = 0.83). C and D: Ccnd1, Vegfa, and Myc oncogene expression. mRNA was measured in colon tissue of ApcMin/+ mice on a control diet or daily 1% niacin, as described for panel B above. Median values for control and niacin-fed mice (respectively) were: for Ccnd1, 0.13 and 0.15 (P = 0.30); for Vegfa, 0.16 and 0.22 (P = 0.30); for Myc, 0.21 and 0.46 (P = 0.005). * indicates P < 0.05.

