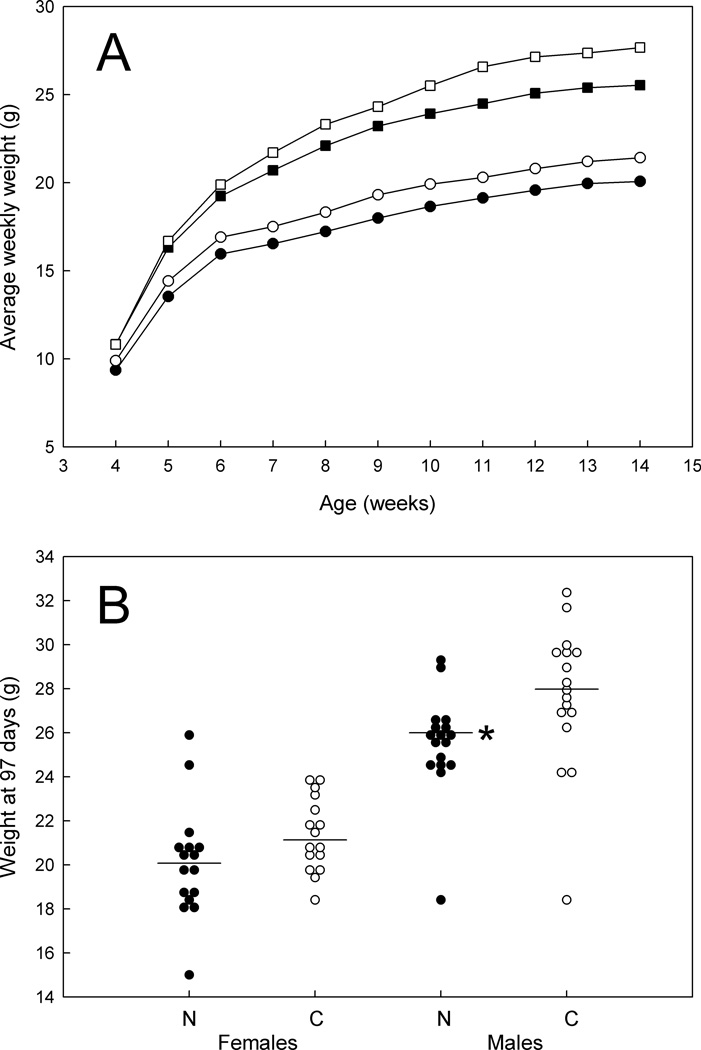
FIG. 3.
Growth of ApcMin/+ mice on 1% niacin versus control diets. A: Combined average weights of the mice, by week. Open squares, males on the control diet. Filled squares, males on the 1% niacin diet. Open circles, females on the control diet. Filled circles, females on the 1% niacin diet. B: Weights at 97 days (14 weeks). N, mice on the 1% niacin diet. C, mice on the control diet. * indicates P < 0.05.

