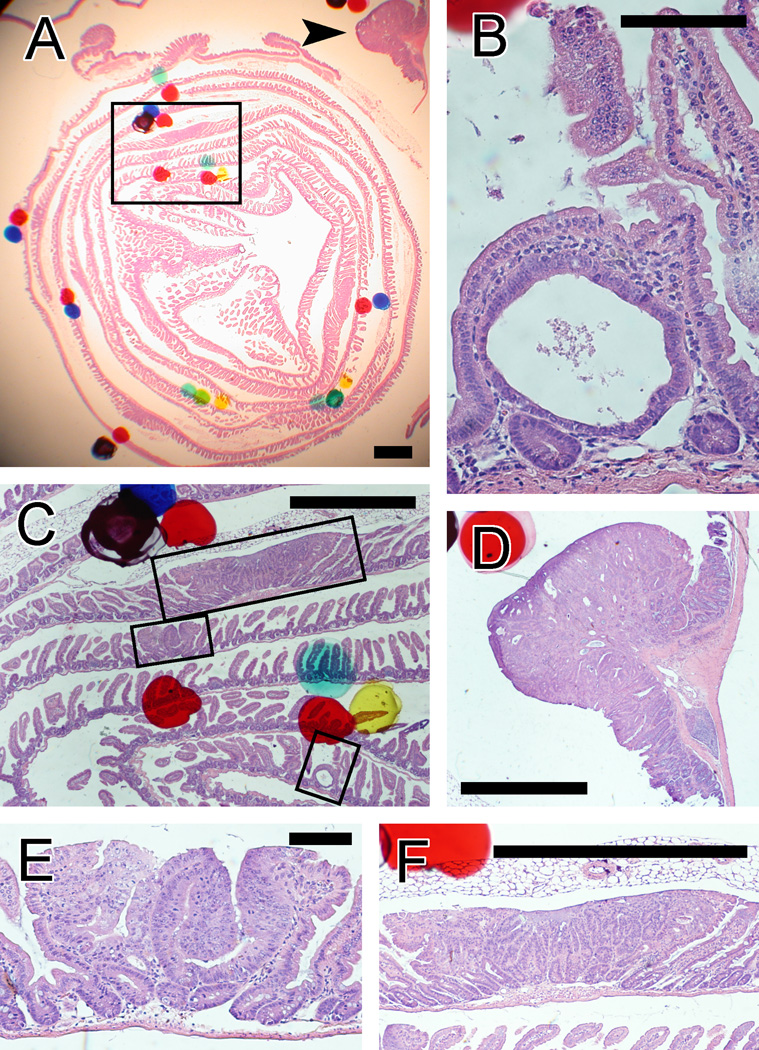
FIG. 4.
Examples of intestinal tumors in a Swiss roll section from an ApcMin/+ mouse, seen through a stereomicroscope (A) and at higher magnification (B–F). Hematoxylin and eosin staining. A: Tumors are visible with very low magnification (<40×), although screening of slides was also done with higher magnification, to detect early tumors. The box indicates the area shown in panel C. The arrow indicates the tumor seen in panel D. Scale bar = 1 mm. B: An early, intravillar adenoma with a single neoplastic gland. Scale bar = 100 µm. C: Adenomas of all sizes, from intravillar tumors to large adenomas. The upper, middle, and lower boxes indicate the areas shown in panels F, E, and B, respectively. Scale bar = 1 mm. D: A large colon tumor. Scale bar = 1 mm. E: A small adenoma, defined as seen on only one section. Scale bar = 100 µm. F: A large adenoma, which was seen in 5 sections. Scale bar = 1 mm.

