
Figure 5. Developmental expression of LTP at inhibitory synapses onto O-LM INs.
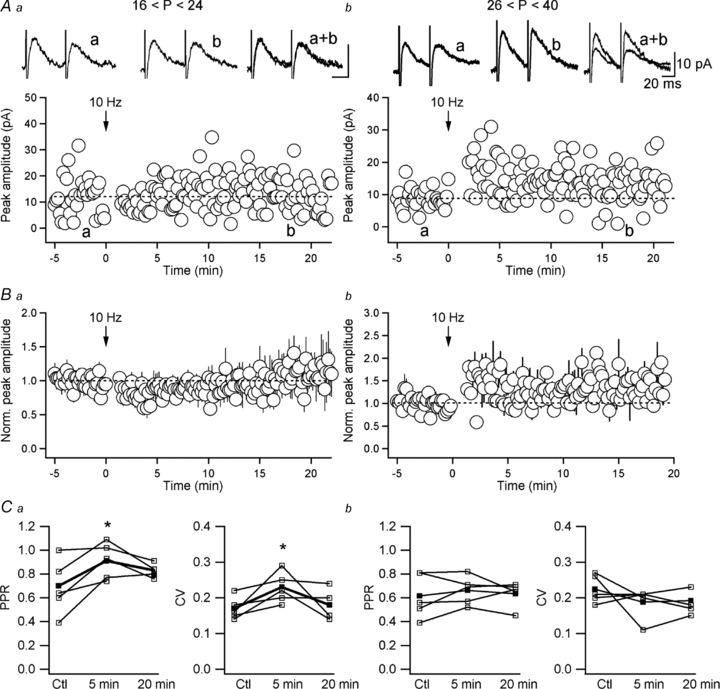
A and B, representative recordings (Aa, Ab) and normalized group data (Ba, Bb) of eIPSC amplitude obtained from INs of juvenile (A; n = 4) and adult (B; n = 5) mice, showing short-term depression of eIPSCs induced by 10 Hz stimulation in INs of juvenile animals and long-term potentiation (LTP) of eIPSCs in mature INs. The traces at the top are average eIPSCs (average of 30 sweeps) in control (a), 20 min after tetanization (b), as well as their superimposition. C, summary graphs showing changes in the eIPSC PPR and CV induced by 10 Hz stimulation in juvenile (Ca) and adult (Cb) animals. Note that LTP of eIPSCs in O-LM INs was not associated with changes in PPR or CV (Cb), indicating a postsynaptic locus for its expression.