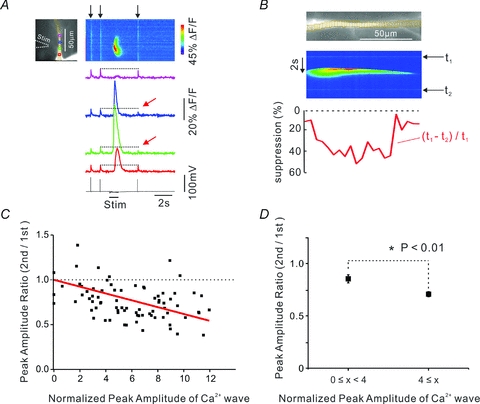
Figure 3. The reduction in the bAP-evoked [Ca2+]i increase is greatest at locations with the largest wave-generated [Ca2+]i increase.

A, typical experiment measuring reduction in bAP-evoked [Ca2+]i increase following a synaptically evoked Ca2+ wave. The largest reductions (red arrows) were at the blue and green ROIs at the centre of the wave. Indicator, 200 μm OGB-5N. B, detailed profile (red trace) of the signal suppression (per cent of bAP signal at each location) along the dendrite (different cell) showing greatest effect where the wave-evoked [Ca2+]i increase was largest. C, summary of data from 8 cells. The amplitude of the [Ca2+]i increase from the wave at a specific location was normalized to the amplitude of the bAP signal evoked at that location before the wave was generated. Several locations were chosen for each cell. Larger reductions were measured at locations with the largest wave-generated [Ca2+]i increases. The red line is the best fit to the data, with the line forced to 1.0 when the [Ca2+]i change was 0. D, the same data grouped into two bins showing that the suppression was significantly greater for larger [Ca2+]i changes.
