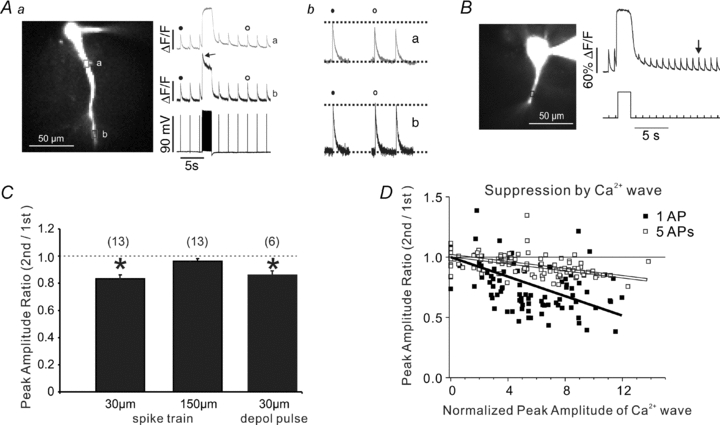
Figure 6. Ca2+ entry through VGCCs suppresses bAP-evoked [Ca2+]i increases.

Aa, an experiment similar to the one in Fig. 5 except a train of intrasomatically evoked bAPs at 100 Hz was generated instead of a Ca2+ wave; the indicator was 50 μm OGB-1 and the 40× lens was used to view a larger field. Ab, a reduction in the bAP signal was detected at the dendritic ROI (a) 30 μm from the soma, but no change was detected 150 μm from the soma (ROI b). Amplitudes were determined by averaging responses 6–10 s after the spike train. Note the sharp transient during the train at the distal location (arrow) reflecting frequency-dependent spike backpropagation (see text). B, a similar experiment using a depolarizing step instead of the bAPs. A 2 s pulse from –70 to 0 mV was generated in voltage clamp mode. The amplitude of the bAP-evoked signals was reduced for at least 10 s. For quantitative measurements the signal at a time when the slow baseline recovered to resting level (arrow) was used. C, summary histogram of the experiments. Both the bAP train and the depolarizing pulse significantly suppressed the bAP signal 30 μm from the soma but there was no suppression from the train 150 μm from the soma (P < 0.05, two-tailed t test; n = 13). D, data (open squares and line) from experiments similar to those in Fig. 1 except that the control and test conditions were a train of 5 bAPs at 40 Hz. The suppression was proportional to the amplitude of the Ca2+ wave (normalized to the bAP signal measured at the same location) but not as great as the suppression of the signal from a single bAP (filled squares and line; data from Fig. 3C).
