
Figure 8. Ca2+ waves but not trains of bAPs suppress the rate and amplitude of Ca2+ release events.
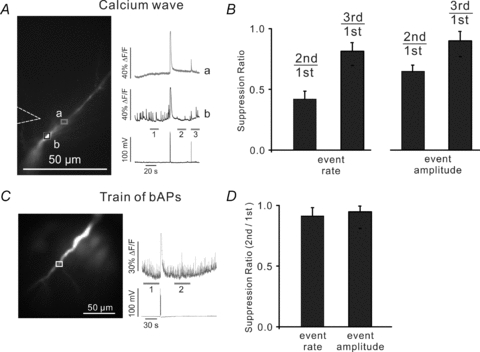
A, during a long recording localized [Ca2+]i increases were detected at one location in the dendrites (black ROI, b) but not at a nearby location (grey ROI, a). Indicator was 50 μm OGB-1. The mean rate and amplitude of the events in a 20 s period after the wave was less than before the wave. B, summary histogram of data from 8 experiments showing significant reductions in both parameters. C, similar experiments testing the effect of 100 bAPs at 100 Hz. There was no apparent effect on the rate or amplitude of the spontaneous events. D, summary histogram of data from 6 experiments showing no significant changes in either parameter.