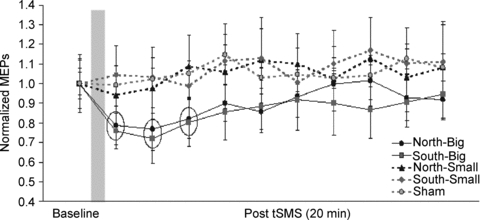
Figure 4. Experiment 1. Time course of the effects of the different kinds of tSMS and of sham stimulation on normalized MEPs.

The grey column represents schematically the time of stimulation. Each time point is the average of 2 min. To reduce the number of multiple comparisons, statistical analyses were limited to the first 10 min after the end of stimulation (baseline plus 5 time points of 2 min each). The dotted circles indicate those data that are statistically significant. Error bars are standard errors of the mean.
