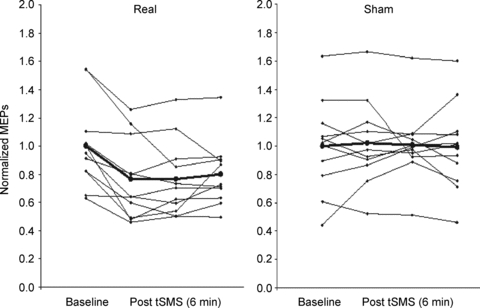
Figure 6. Experiment 2. MEP amplitudes in individual subjects.

Time course of the effects of 10 min of tSMS using the Big Magnet and south polarity and of sham stimulation on normalized MEPs. Each time point is the average of 2 min. Here we show the baseline plus 3 time points of 2 min each (6 min). The bold line and circles indicate the mean.
