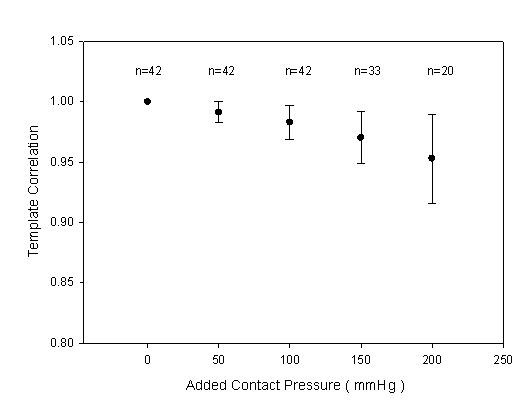
Figure 12.

The statistic data were the relation between excessive contact pressure and template correlation coefficients with the mean (solid circle) and standard deviation (bar). The contact pressure of the reference pattern was set as the base, 0 mm Hg, n was the sample number.
