Figure 4.

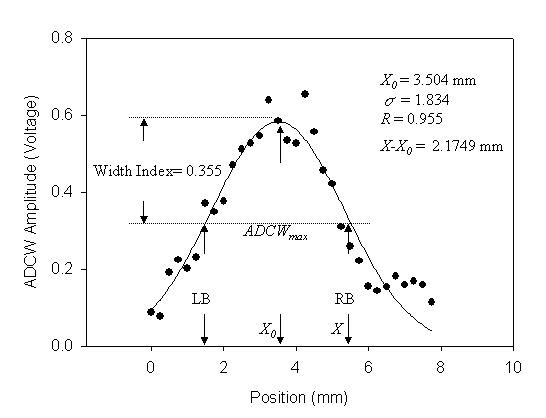
Static ADCW-position relationship from the ADCW shown in Fig. 2(c). The dots and the line are the measured data and the regression function. LB and RB are the left and right boundaries of the estimated arterial width.

Static ADCW-position relationship from the ADCW shown in Fig. 2(c). The dots and the line are the measured data and the regression function. LB and RB are the left and right boundaries of the estimated arterial width.