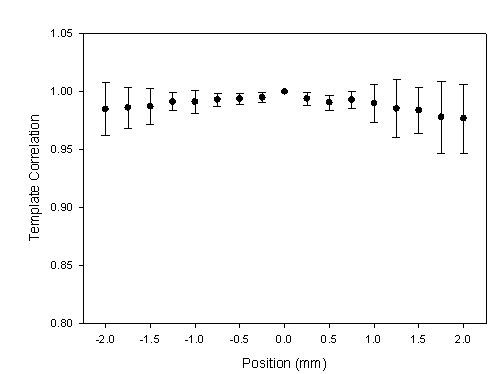
Figure 9.

The statistic data were the relation between the positions and the template correlation coefficients with the mean (solid circle) and standard deviation (bar) in X-axis scanning. The segment of the reference pattern was set as the base position, 0 mm.
