Figure 1.
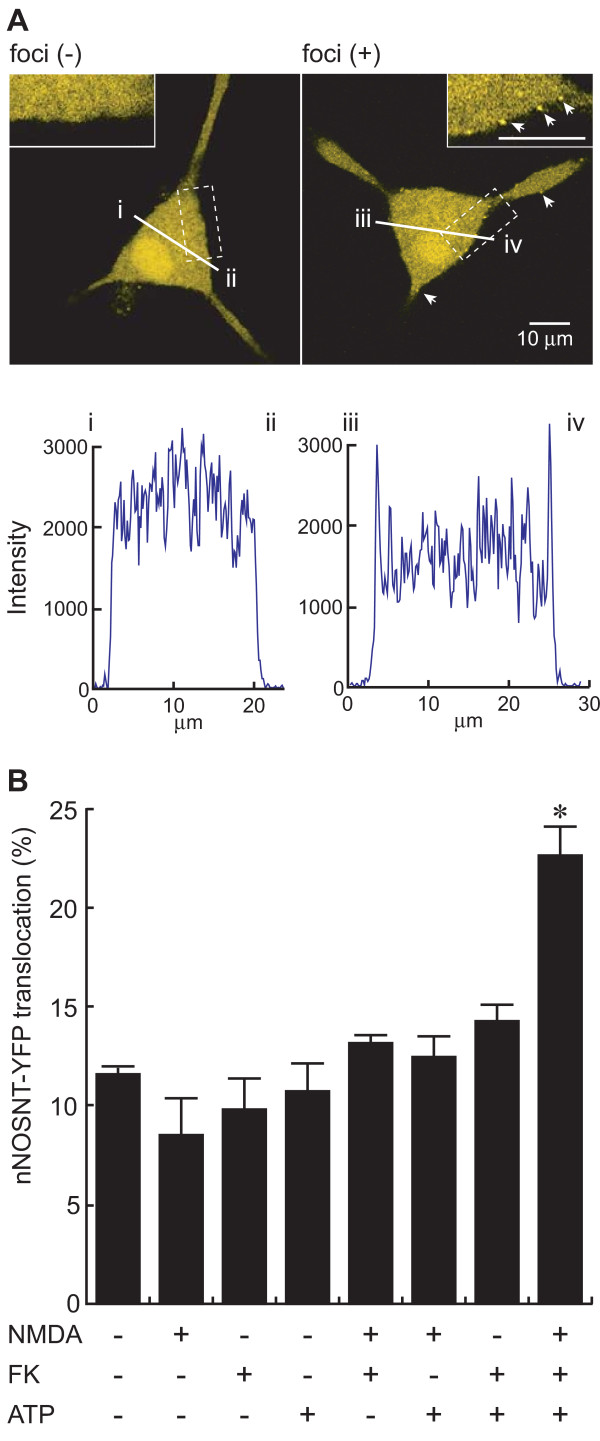
Translocation of nNOSNT-YFP by ATP in PC12N cells. A. Expression and translocation of nNOSNT-YFP in a PC12N cell. After a 30-min incubation of NGF-differentiated PC12N cells with 100 μM ATP, 100 μM NMDA, and 10 μM forskolin (FK), the cells were fixed; and then fluorescent images of the cells without (left) and with (right) foci were acquired by a confocal microscope. Insets in "A" depict higher magnification of the cells delineated by rectangles. The fluorescence intensity of nNOSNT-YFP was quantified along the indicated lines by using ImageJ. In these digital images, points "i-ii" and "iii-iv" represent the edges of the cells. B. Involvement of ATP in nNOSNT-YFP translocation in PC12N cells. After a 30-min incubation of NGF-differentiated PC12N cells with the indicated combinations of 100 μM ATP, 100 μM NMDA, and/or 10 μM FK, the translocation was calculated as described under "Methods." About 40 cells in a 35-mm glass-bottomed dish were examined in each translocation assay by using a confocal microscope; and the cells showing foci of yellow fluorescence of nNOSNT-YFP on the plasma membrane, as shown in "A," were considered to be positive for nNOS translocation. Data are presented as the mean ± SEM of four translocation assays. *p < 0.05 compared with vehicle.

