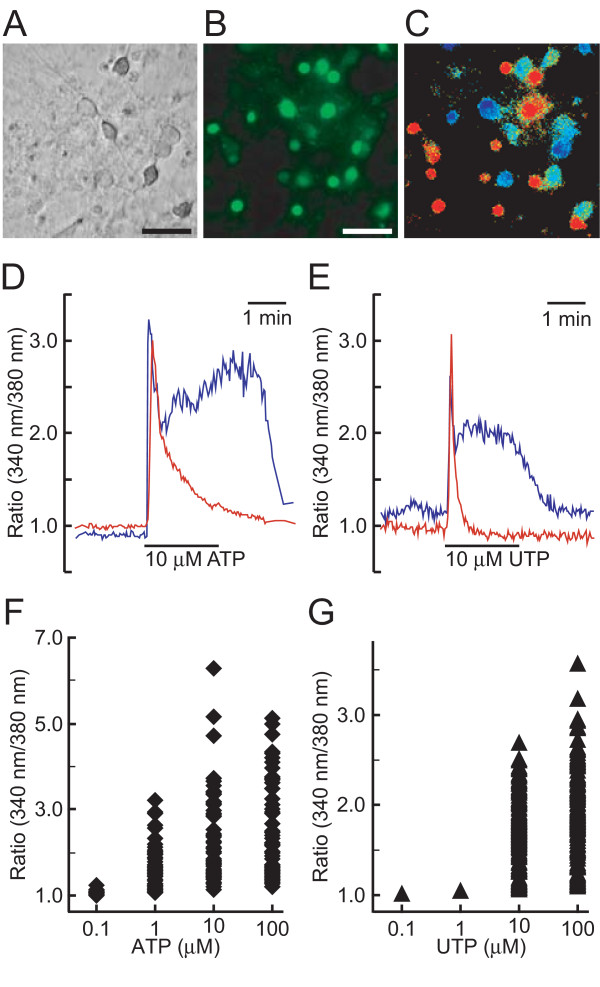
Figure 8.
Effect of ATP and UTP on intracellular Ca2+ concentration ([Ca2+]i) in spinal neurons. A-C. Increase in [Ca2+]i by ATP in spinal neurons. Bright-field photomicrograph of cultured spinal neurons (A), fluorescence image of fura-2-loaded neurons excited at 340 nm (B), and ATP (10 μM)-evoked [Ca2+]i changes in spinal neurons shown in pseudocolor as the ratio of fura-2 fluorescence intensity at 340/380 nm (C). Scale bars, 50 μm. D, E. Representative traces of [Ca2+]i changes in single spinal neurons by ATP and UTP. Spinal neurons in the same field showed phasic (red) and tonic (blue) responses by 10 μM ATP (D) and 10 μM UTP (E). F, G. Distribution of [Ca2+]i responses of individual spinal neurons to ATP and UTP. Fura-2-loaded spinal neurons were sequentially stimulated with the indicated concentrations of ATP (◆) and UTP (▲) in HBS, after which the peak levels of [Ca2+]i in single neurons were plotted at each concentration. Total 177 and 143 cells of 3 independent primary cultures were measured for ATP and UTP, respectively, and about 90% of the cells responded to ATP and UTP at 100 μM.

