FIGURE 4.

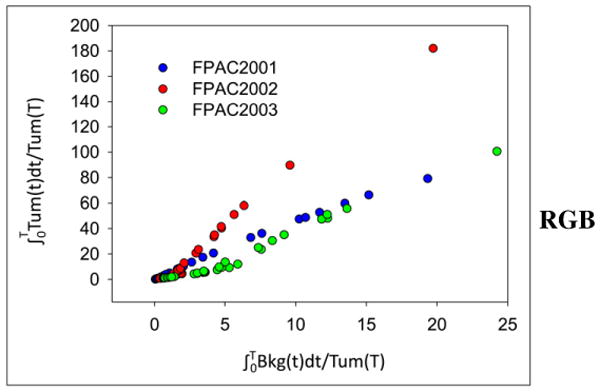
Graphical analysis of dynamic tumor data for all 3 patients. Slope of linear portion estimates distribution volume ratio of tumor and reference tissue (in this case, contralateral noninvolved breast).

Graphical analysis of dynamic tumor data for all 3 patients. Slope of linear portion estimates distribution volume ratio of tumor and reference tissue (in this case, contralateral noninvolved breast).