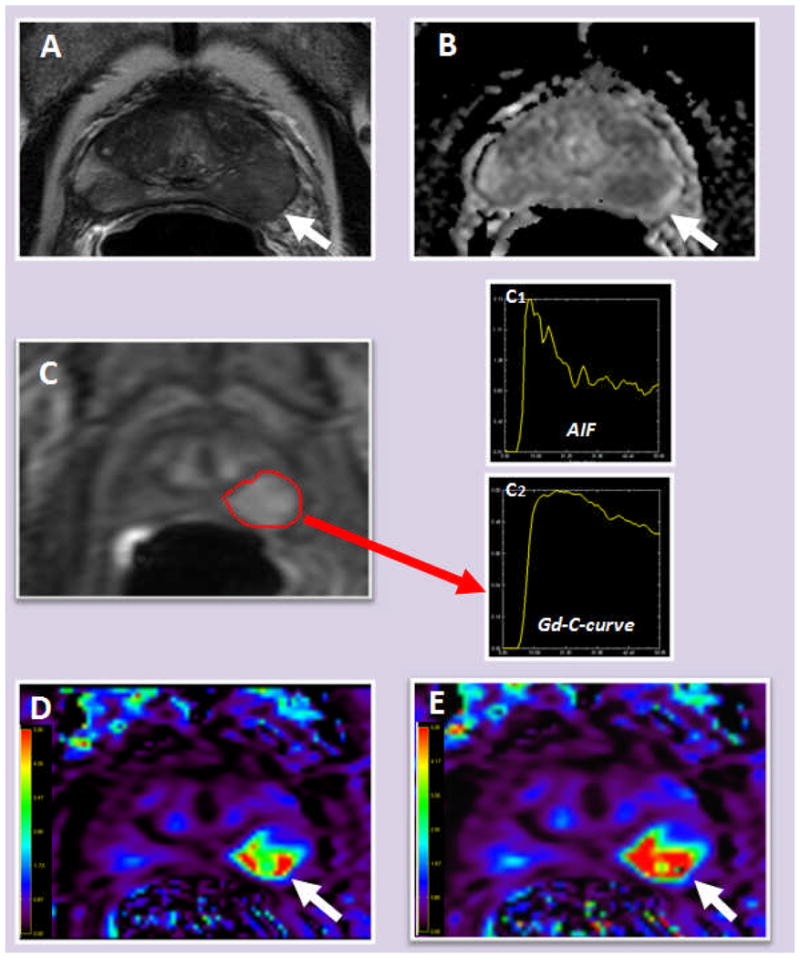
FIGURE 1.

65-year-old man with serum prostate specific antigen (PSA) level of 9.2 ng/dl. Axial T2 weighted MRI shows a vague low signal intensity lesion in the left mid-base peripheral zone (arrow) (A); ADC maps derived from diffusion weighted MRI shows restricted diffusion within the left peripheral zone lesion (arrow) (B); raw DCE MR image demonstrates fast and early enhancement within the left peripheral zone lesion (marked in red) (C) (C1: arterial input function curve, C2: Gd concentration curve of the left peripheral zone lesion); Ktrans (S) and kep (E) maps derived from DCE MRI also localizes the left peripheral zone lesion (arrow).
