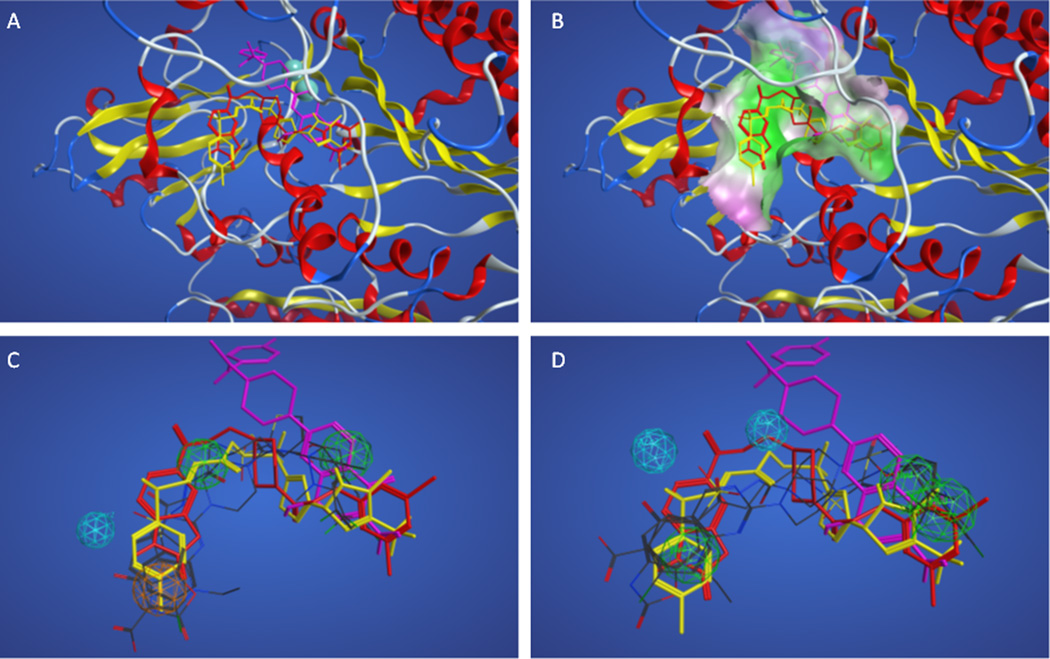
Figure 3.
Superpositions of training set B actives. Panel A. Superposition of actives based on docking with PF8380, KM04131, and pipemidic acid 27 shown in red, yellow and magenta sticks, respectively. Panel B. Superposition of actives colored as in panel A based on docking showing nearby enzyme surface colored green for lipophilic and magenta for hydrophilic regions. Panels C–D. Docked superposition of actives colored as in panel A over ligand-based superposition of actives from Table 3 model #1 (Panel C) and model #31 (Panel D).

