
Figure 1. Tissue degeneration in the aging Drosophila gut.
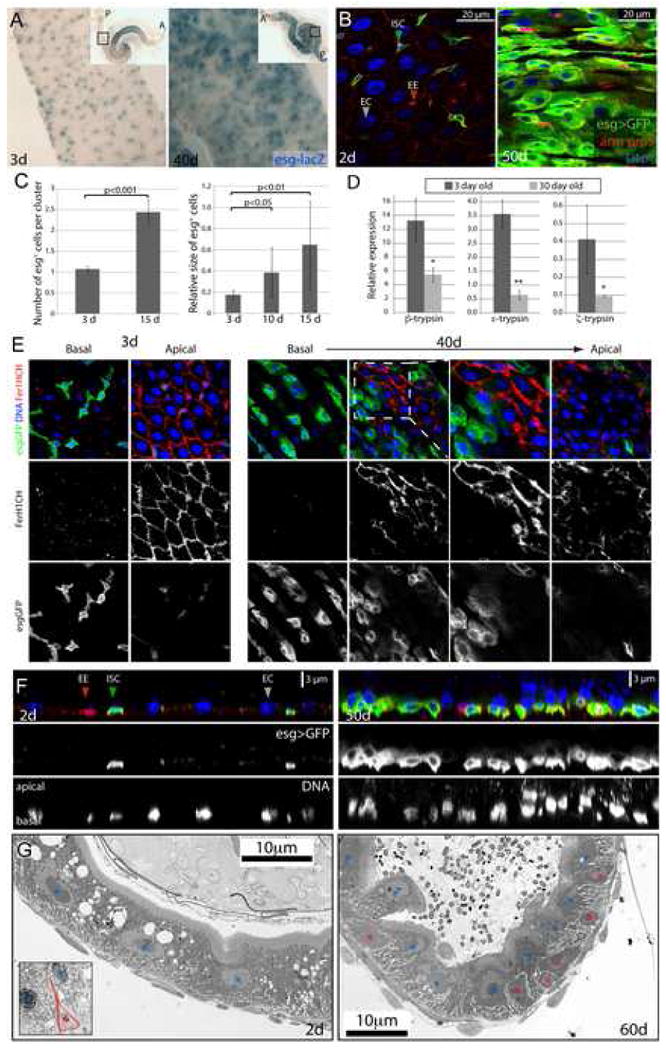
A. ISCs and EBs in young (3 days) and old (40 days) guts labeled by X-Gal staining (genotype: y,w;P{lacW}esgk00606/CyO). Inserts show overview of the depicted guts (A: anterior; P: posterior; endogenous β-Galactosidase Figure S1).
B. Confocal images of aging guts from flies expressing GFP in ISCs and EBs (genotype: w1118; esgGal4, UASGFP). ISCs and EBs are labeled by GFP expression (esgGal4>UASGFP, green) in young flies. Cell boundaries are labeled by immunostaining against Armadillo (membrane red), EE cells are labeled by nuclear pros staining (nuclear red). DNA detected by Hoechst staining (blue). Additional images are shown in Supplementary Figure S2.
C. Age-related changes in the intestinal epithelium quantified by measuring the averages of cell number and size in esg+ cell clusters. Relatively young guts (3, 10 and 15 days) were scored to allow for accurate quantification of the observed parameters. Widespread disorganization (compare with B) prevents accurate identification of individual clusters of cells in older guts. p-values were determined using Student’s t-test.
D. Reduction of trypsin expression in the aging gut. Expression of three different trypsin isoforms was measured by real-time RT-PCR in cDNA prepared from dissected guts from young and old flies. Expression is normalized to the expression of the rp49 gene. p-values were calculated using Student’s t-test: * p<0.05; **p<0.01.
E. Confocal images of guts from young and old flies expressing GFP under the control of esgGal4. Fer1HCH, detected by immunostaining (red), is expressed specifically in ECs in young flies.
F. Cross-sections of guts from old and young esgGal4>UASGFP flies illustrating the loss of the monolayered architecture of the intestinal epithelium in older animals. ISCs and EBs are GFP positive (green), EE cells are labeled by nuclear pros staining (red) and DNA detected by Hoechst staining (blue).
G. Ultrastructural analysis of cross-sections of young and old guts using Transmission Electron Microscopy. Blue asterisks indicate enterocytes, red asterisks mark ISCs or cells accumulating in the basal part of the epithelium. A representative ISC in young intestines is outlined in the insert of the left panel. Additional and higher magnification images are presented in Supplementary Figure S5.