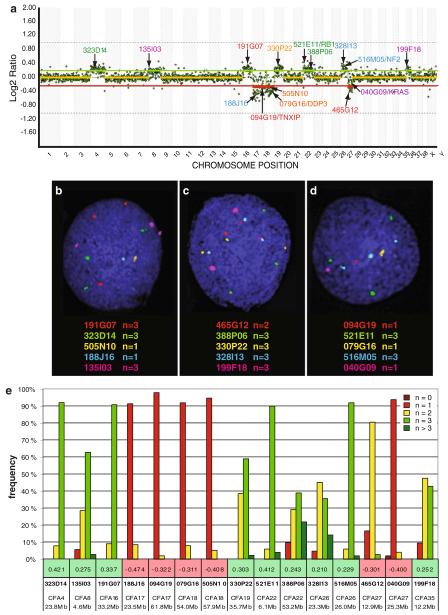
Fig. 1.
a Example whole genome aCGH profile from analysis of a grade I meningioma from a 10 year old male Golden Retriever, co-hybridized with male reference DNA. Data are plotted as the median, block-normalized and background-subtracted log2 tumor DNA:reference DNA ratio of the replicate spots for each arrayed BAC clone. Log2 ratios representing genomic gain and loss are indicated by horizontal bars above (green line) and below (red line) the dashed midline (orange line) that represents normal copy number. The chromosome copy-number status line for the tumor appears as an orange overlay of the center-line when there is a normal copy number, and as either red (loss) or green (gain) in regions where genomic imbalances were apparent, as determined by the aCGH Smooth algorithm [24]. Here, chromosome gain is apparent for CFA 4, 8, 16, 19, 26 and 35. This case also shows the characteristic losses of CFA 17 and 27 that were highly recurrent in our dog meningioma panel, as well as loss of CFA 18. The aCGH profile is annotated with the clone address of 15 BAC clones from the 1 Mb array that were used in subsequent FISH analysis of this case. Five of these 15 clones have previously been shown to contain the full coding sequence of a key cancer-associated gene (TXNIP, DPP3, RB1, NF2, KRAS) [20]. The color of the text denotes the fluorochrome with which the BAC clone was labeled. b–d Targeted FISH analysis of tumor interphase nuclei from the same case using 15 differentially labeled BAC clones (highlighted in a) combined in three separate groups. The modal copy number for each clone is indicated. e Summary of compiled copy number data based on FISH analysis of at least 30 tumor interphase nuclei for each of the 15 BAC clones. The number immediately above each BAC address represents the log2 tumor DNA:reference DNA ratio of the corresponding clone derived from the aCGH analysis. It is evident that the SLP data and the aCGH data are mutually confirmatory

