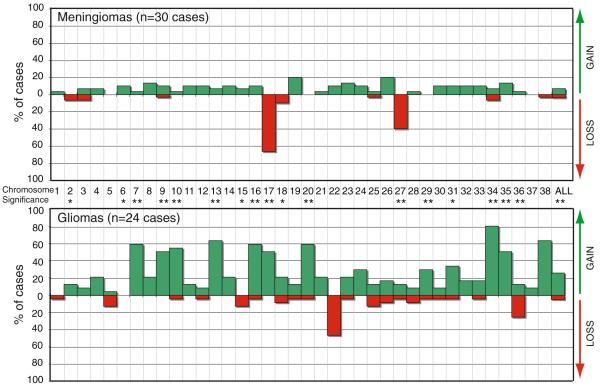
Fig. 2.
Incidence of recurrent chromosome copy number changes in a meningiomas (n = 30 cases) and b gliomas (n = 24 cases). Tumors displaying a normal copy number throughout the genome were excluded from analysis. Each dog autosome is listed along the x-axis, and the y-axis indicates the percentage of the corresponding tumor population that showed copy number gain (green bar above the x-axis) or loss (red bar below the x-axis). The rightmost bars (x = ‘ALL’) show the mean incidence of copy number gain and loss across all chromosomes. Asterisks along the x-axis indicate those chromosomes for which the incidence of recurrent copy number gain or loss differed significantly between the meningiomas and glioma cases analyzed in the present study (* indicates p < 0.05, ** indicates p < 0.01)

