
Fig. 4.
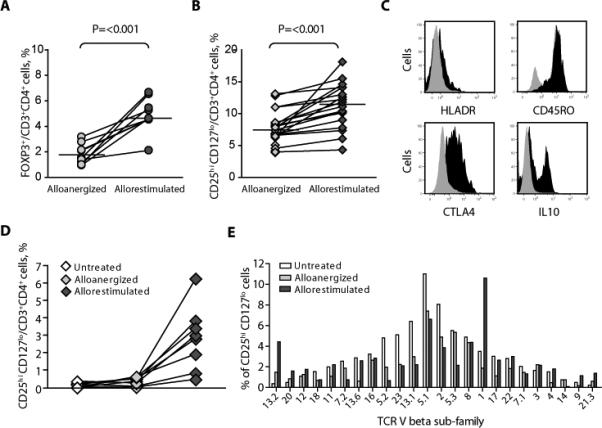
The effect of in vitro allorestimulation of alloanergized PBMCs on the frequency and phenotype of CD4+ Treg cells. (A) Frequency of FOXP3+ cells, expressed as percentage of CD4+ cells, in alloanergized and allorestimulated alloanergized responder PBMCs in nine HLA-mismatched responder-stimulator pairs. Horizontal lines represent median values. P value is for a two-tailed paired t test. (B) Frequency of CD25hiCD127lo cells, expressed as percentage of CD4+ cells in alloanergized and allorestimulated alloanergized responder PBMCs in 22 different HLA- mismatched responder-stimulator pairs. Horizontal lines represent median values. P value is for a two-tailed paired t test. (C) Cell surface and intracellular markers on CD4+ Treg cells after in vitro allorestimulation of alloanergized responder PBMCs. Histograms are from one representative experiment (of six). Black, FOXP3+CD4+ cells; gray, FOXP3–CD4+ cells. (D) Frequency of CD25hiCD127lo cells, expressed as percentage of CD4+ cells in untreated, alloanergized, and allorestimulated alloanergized responder PBMCs in eight HLA-mismatched responder-stimulator pairs after depletion of CD4+ Treg cells from starting populations of untreated PBMCs. (E) Histogram showing TCR Vb subfamily distribution in CD4+CD25hiCD127lo Treg cells before and after alloanergization and allorestimulation with HLA-mismatched stimulators. One representative experiment (of three) is shown.