
Figure 3.
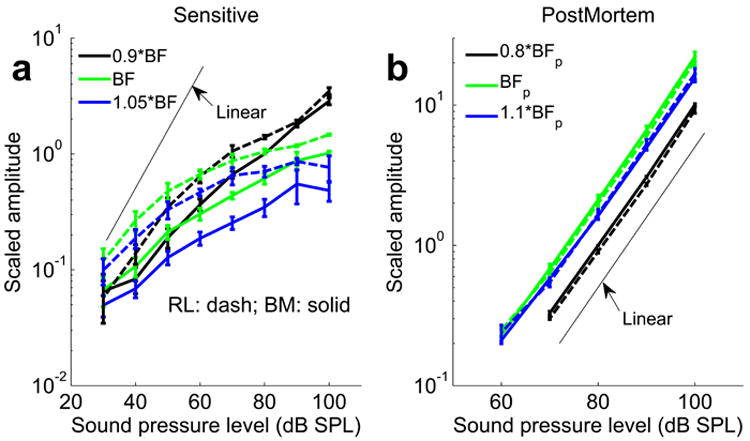
Displacement magnitude as a function of sound level (“input-output function”) measured from the basilar membrane (BM) and reticular lamina (RL). a, Input-output functions of BM (solid lines) and RL displacement (dashed lines); b, Postmortem input-output functions. Data plotted as mean ± standard error. Frequencies were normalized with respect to the best frequency of each animal. The frequency “0.9*BF” represents the frequency 0.9 times below the best frequency, and the frequency “1.05*BF” represents that 1.05 times above it. This compensates for slight variations in best frequencies in different experiments (best frequency range, 18.25-19.5 kHz). BFP is the best frequency at postmortem and it is around 15 kHz in the experiments. The thin lines mark a linear relationship between the sound pressure level and vibration amplitude.