
Figure 4.
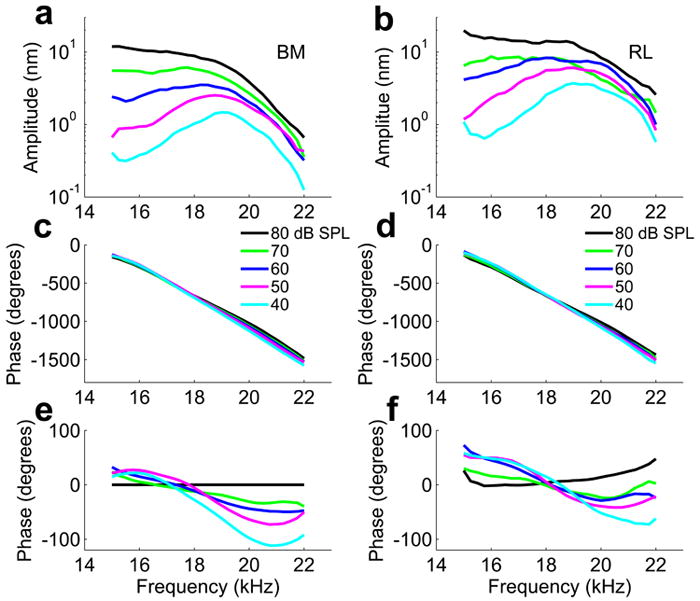
Sound-induced vibration of the basilar membrane (BM) and reticular lamina (RL) at the 19 kHz best frequency location in an animal with 7 dB sensitivity loss due to surgical preparation. a, b, Displacement amplitude versus frequency. c, d, Displacement phase relative to the speaker driving voltage versus frequency. e, f, Relative phase versus frequency at different sound levels with respect to the phase at 80 dB SPL. Numbers against the color lines in panels c and d represent the sound pressure level, which applies to all panels in this figure. Different sound levels were delivered in random order to avoid systematic errors. In panel b, the RL displacement magnitude at 70 dB SPL is affected by additional sensitivity loss of ~6 dB. This was the last measurement of the experiment.