
Figure 4.
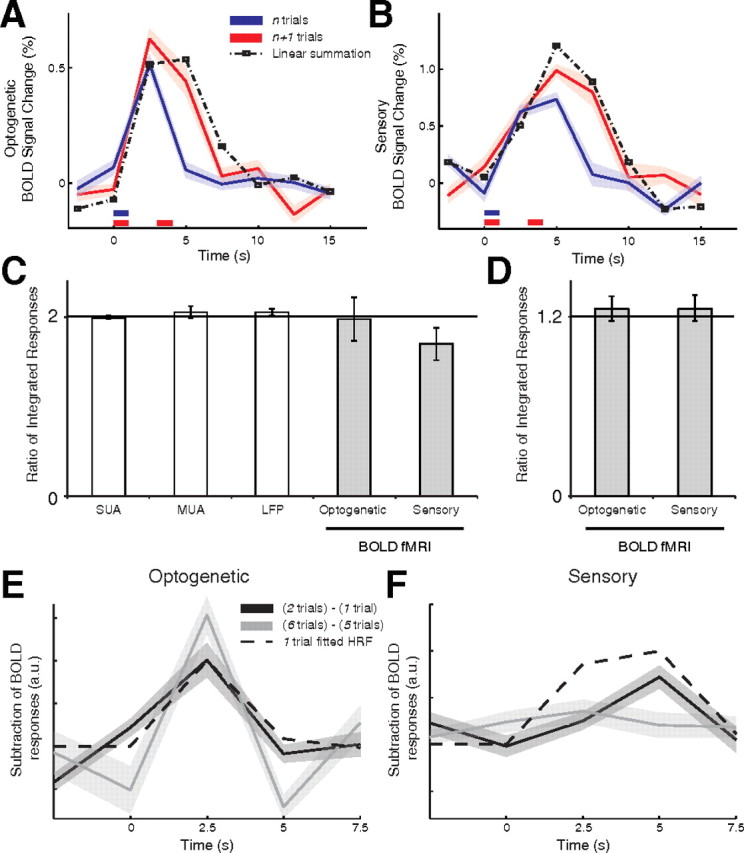
BOLD temporal linearity. A, Optical stimulation evoked equivalent responses across multiple independent 1 s trains. Average time series (n = 6 animals) of the BOLD fMRI response to one 1 s interval (single) and two trains of 1 s intervals (double) with an interstimulus interval of 2 s. Data are expressed as mean ± SEM (individual runs across all animals). Linear summation of the single trial to a 3 s shifted single trial (dashed line) provides a qualitative estimate of the temporal summation. B, Linear summation similarly holds for sensory stimulation. C, D, The temporal linearity response was quantified by dividing the response for the (n + 1) trials condition by the (n) trials condition. E, F, A hemodynamic response function fitted to the single trial condition is plotted against the subtracted responses for the single − double and quintuple − sextuple trial conditions. Optogenetic refers to optical drive, Sensory to sensory drive.