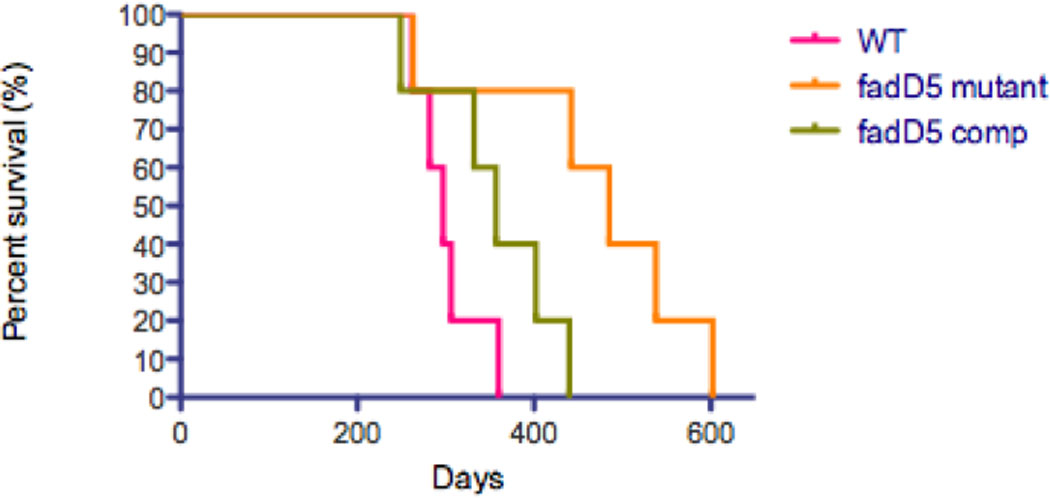
Fig. 6. Survival kinetics of C57/BL6 mice infected with M. tuberculosis strains.

Percent survival of mice after aerosol infection with the WT and complemented strains compared against fadD5-mutant infected mice (5 mice per group). Kaplan-Meier curve was generated by GraphPad Prism software (p<0.05 for comparison of mice infected with WT or complemented strain vs fadD5-infected mice, Mantel-Cox log-rank test).
