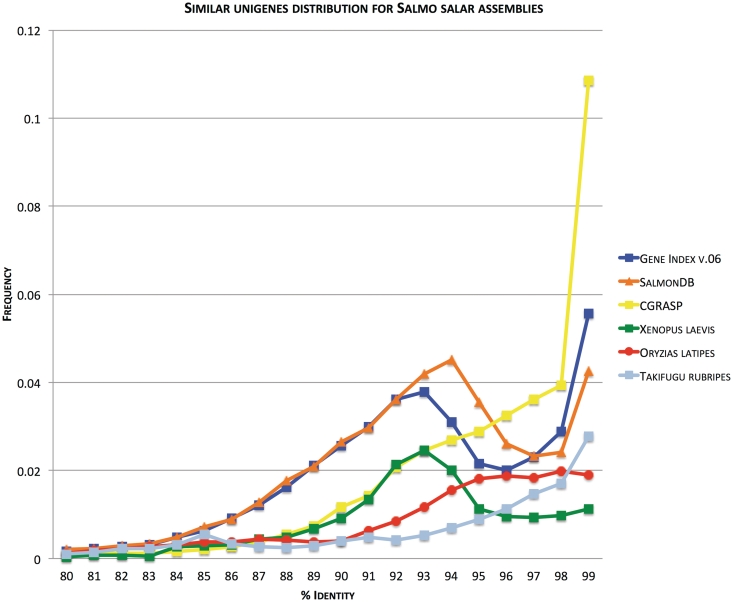
Figure 3.
Frequency of aligned Unigenes plotted against percent identity. Figure (modified from [45]) shows frequency of top-pairwise alignment (E < 1e-10; query and subject coverage = 0.9) between Unigenes generated through our assembly pipeline plotted against identity score (SalmonDB, orange). It also shows the relationships among the contig consensus sequences of gene index EST assembly (Gene Index, blue) and cGRASP EST assembly (CGRASP, yellow) for Atlantic salmon. The same analysis is included for Fugu (Takifugu rubripes, light blue) and Medaka (Oryzias latipes, dark red) mRNAs obtained from Ensembl and the African Clawed Frog (Xenopus laevis, green) Unigenes obtained from NCBI. Since there is no standard metodolgy to compare EST assemblies (e.g. Genome assembly has N50 value), a good approximation is to observe the expected pattern for a duplicated genome using this strategy. We include the African clawed frog because it has a well-documented recent genome duplication. The expected pattern is shown in the figure with a peak around 93–94%. The same is expected for Salmon which suffered from a whole genome duplication ∼100 million years ago. SalmonDB and gene index assembly show these accumulation of paralogs around 93–94% identity.

