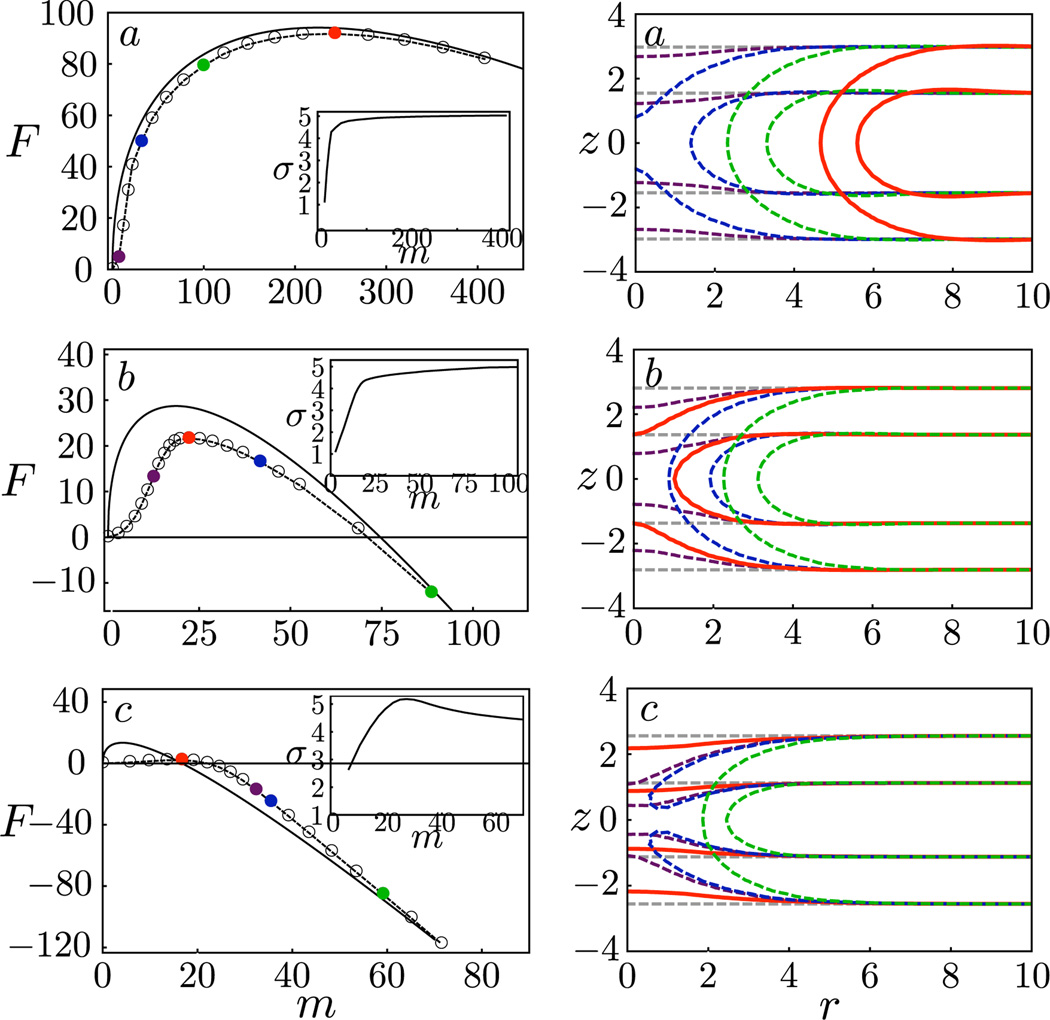
FIG. 3.
(color online). Left: Free energy as a function of the deficiency in the number of lipids: MEP (dashed lines, states given by the colored markers) and CNT (solid lines). Right: density profiles for images along the respective MEPs. The contour lines correspond to 25% of the maximum solvophilic (A) density of the initial intact membrane. In all cases, the critical nucleus is shown in red [medium gray] and the intact membrane in light gray. From top to bottom: γa, γb, γc = 0.85, 2.73, 4.52.

