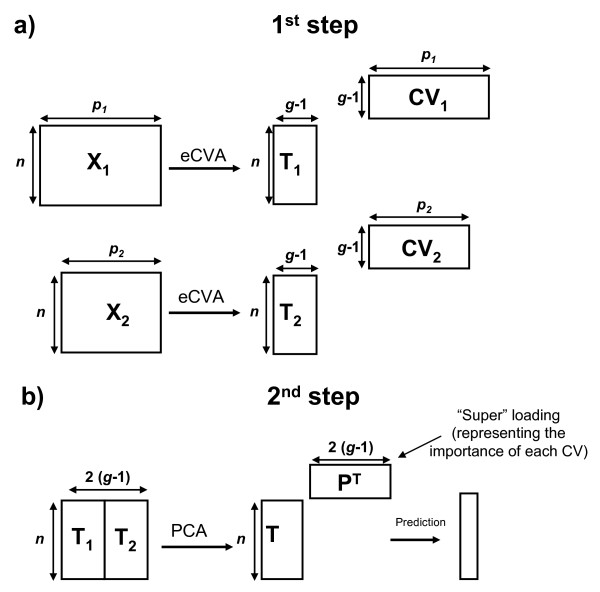
Figure 1.
Architecture of the mid-level fusion analysis employed here on two data sets X1and X2. The same n samples are divided in g groups. a) eCVA is applied on each data set to determine the Canonical Variates CV1and CV2allowing the best discrimination and the corresponding scores T1and T2. b) The scores are merged and analyzed using PCA. The global scores T and super loadings PTare obtained. Class prediction is obtained based on T.

