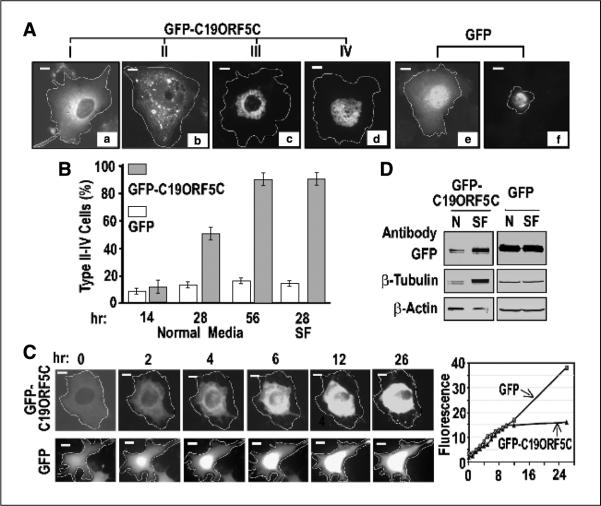
Figure 1.
Cellular distribution patterns of GFP-C19ORF5C. A, four general morphologic profiles of GFP distribution in COS7 cells transfected with GFP-C19ORF5C. Cells were classified as type I to IV according to increasing association with punctiform aggregates. Cell boundaries were located by light microscope and then determined by increasing exposure times to maximum to detect total GFP signal across the field. The transfected cell periphery was then outlined as indicated. Field exposure was then reduced to facilitate maximum resolution of the high-intensity punctate structures. Bars, 10 μm in all photomicrographs. B, time-dependent increase in type II to IV cells exhibiting punctiform aggregates of GFP-C19ORF5C. Columns, mean counts of type I to IV cell types from three independent experiments in which at least 500 total transfected cells among 50 microscopic fields were counted at the indicated times; bars, SD. Normal medium contained 5% fetal bovine serum. SF, serum-free medium. The number of cells exhibiting the conventional apoptotic morphology in (A, f) was scored in cultures transfected with GFP alone (open columns). C, time-dependent perinuclear clustering of GFP-C19ORF5C in single transfected cells at room temperature. Images were captured at the indicated times from single cells observed continuously. Representative cell of replicate observations and time-dependent increase in intensity of GFP fluorescence in single cells expressing GFP-C19ORF5C or GFP. Relative florescence intensity was determined by dividing the average fluorescence intensity in arbitrary units in a field with brightest florescence in the cells by that of a field of the same size outside the cell boundary. D, direct analysis of total GFP-C19ORF5 or GFP, β-tubulin, and β-actin in transfected cells. GFP-C19ORF5C or GFP transfected COS7 cells were cultured in 25 cm2 tissue culture flasks in medium with (N) or without 5% fetal bovine serum (SF) for 28 hours. Extracts were made from 8 × 10⁵ cells collected by scraping into 200 μL buffer I. An equal amount of soluble protein (160 μg) was applied to each lane of SDS-PAGE, and after electrophoretic transfer, GFP-C19ORF5C, GFP, tubulins, and actin were detected with 1 μg/mL polyclonal antibody against GFP or monoclonal antibodies against β-tubulin or β-actin. Bands were visualized with 0.1 βg/mL alkaline phosphatase–conjugated anti-rabbit IgG or anti-mouse IgG antibodies.

