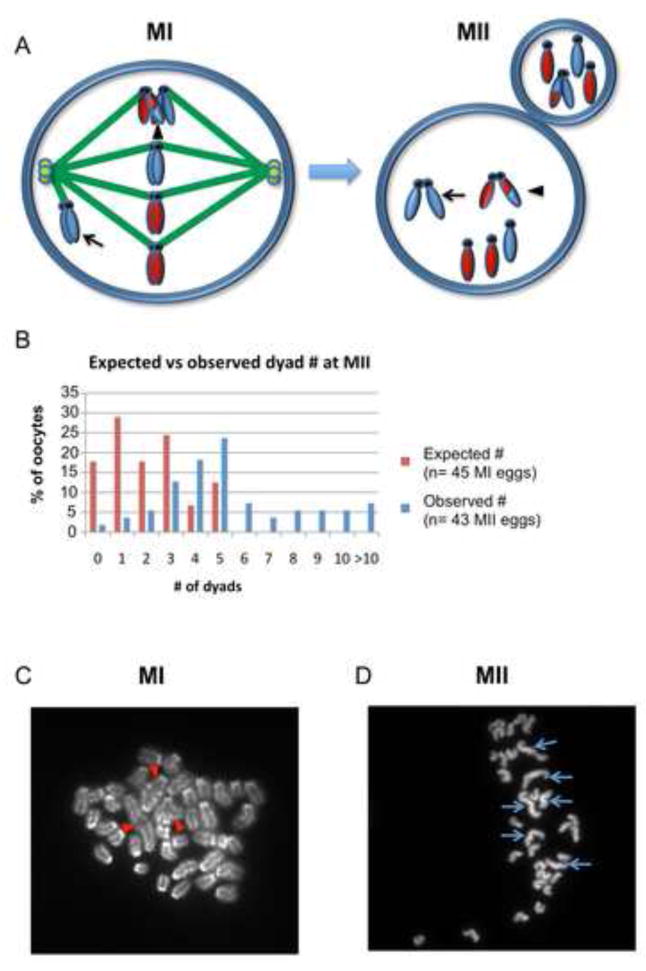
Figure 4. MII chromosome analysis provides evidence of intact segregation of univalents.
(A) Schematic showing the segregation patterns that give rise to dyads and monads at MII. Homologs with an exchange (arrowhead, MI cell) will segregate reductionally, resulting in a dyad with genetically distinct chromatids (arrowhead, MII cell). In addition, a univalent that forms a monopolar attachment (arrow, MI cell) will segregate intact, resulting in a dyad with genetically identical sister chromatids (arrow, MII cell). Univalents that form bipolar attachments and segregate equationally will result in single chromatids (monads) at MII. (B) Comparison of the expected number of dyads with the number observed; expected values were based on data from the cytogenetic analysis of 45 MI oocytes (Figure S1) and assuming that dyads derive only from MI bivalents. (C) Representative image of an MI chromosome preparation showing 3 bivalents (red arrowheads) and 34 univalents. (D) Representative image of an MII chromosome preparation with 6 dyads (blue arrows) and 27 monads.

